Live Market Command Center
Live BTC ticker + closed-candle indicators across active timeframes. The browser pulls Binance public endpoints every 30s while the tab is open; if Binance is region-blocked, panels fall back to the public Phase 2 closed-candle artifacts in data/public/candles_*.json (sourced server-side from coinbase / kraken) and label themselves with the artifact source + freshness. If both feeds are unavailable, panels render STALE / unavailable rather than fabricating data. Educational research only — not financial advice.
Multi-Timeframe Trend Matrix
| Timeframe | Trend | Momentum | Signal | Note |
|---|
Last 24 Hours — Hourly Price Action
Intraday Pattern Engine — Live Detection
Live Derivatives Intelligence
Live tape: Binance public API (browser fetch every 30s).
Derivatives panel: direct fapi.binance.com with fallback to data/public/derivatives.json
when direct calls are region-blocked.
Key levels & pivot/SMA markers: data/public/key_levels.json (Phase 2 artifact).
For research use only — not financial advice.
Forecast Scoreboard — Every Guess, Measured
Every forecast this system makes is published to an append-only public ledger before the outcome is known, then resolved automatically against the exact-horizon candle close and scored. Nothing is deleted, nothing is cherry-picked — the numbers below include every win and every loss. All figures load from the public artifacts (ledger/public/accuracy.json, signal.json, trades.json); none are typed into this page. Educational research only — not financial advice.
Accuracy by Horizon
| Horizon | n | Hit rate | Always-up baseline | vs majority | Maker expectancy | Wilson 95% LB |
|---|---|---|---|---|---|---|
| Loading accuracy artifact… | ||||||
Current Signal — paper contract for the future OpenClaw agent · never a trade instruction
Paper Trade Tape
3D Bitcoin Brain Diagram
A 3D visualization of the BTC Brain's research architecture — 20 conceptual modules and their connections. Decorative diagram only — no machine learning, no live training, and no measured intelligence benchmark are implied.
Neural Module Registry
BTC Brain Coverage System
Internal self-reported coverage state. Shows the author's analytical depth, active research focus, module strength, and whole-brain connectivity. No metric below is a measured prediction-accuracy benchmark.
Coverage Scope (Static · what this site documents)
- BTC/USDT spot ticker (Binance · 30s polling) — see Live Market panel above
- Closed-candle OHLC indicators on 15m / 1h / 4h / daily
- Derivatives (funding, open interest) — direct API or
data/public/derivatives.jsonfallback - Pivot / SMA reference levels —
data/public/key_levels.json - Source freshness budgets —
data/public/source_health.json(Trust panel)
- Halving-cycle framework & analog comparisons — Chapters 3, 4
- On-chain regime (MVRV, Puell, NUPL) — Chapter 6 (no live feed wired into this page)
- Macro / DXY / M2 correlation — Chapter 8 (no live feed wired into this page)
- Black-swan playbook — Chapter 9
- News / catalysts (Clarity Act, ETF flows, etc.) — no live feed wired; not printed as live readings
Brain Intelligence Matrices
Learning System State
- ✓ Halving cycle framework
- ✓ 200W MA as cycle bottom
- ✓ MVRV zone thresholds
- ✓ Pi Cycle Top accuracy
- ✓ Volume breakout rules
- ✓ Bear market drawdown depth
- ✓ F&G extreme readings
- ~ 4-year cycle continuation
- ~ ETF era behavior changes
- ~ Stock-to-Flow accuracy
- ~ Current cycle bottom call
- ~ M2 correlation timing
- ~ Intraday pattern signals
- ~ Retail adoption pace
- ✗ Lightning Network impact
- ✗ CBDC competitive effect
- ✗ Options market influence
- ✗ Sovereign BTC reserve builds
- ✗ AI-driven trading effects
- ✗ Post-cycle 5 framework
- ✗ Sub-1min structure analysis
Whole-Brain Module Connectivity
Measured Forecast Accuracy
Predictive Intelligence Framework
Cognitive Framework (Categories only · No fabricated weights)
- Closed-candle OHLC structure (15m / 1h / 4h)
- Derivatives feed (funding, open interest)
- Macro / on-chain regime (chapters 6 & 8)
- Pivot / SMA reference levels (key_levels.json)
- Cycle-bottom detection (Chapter 3)
- M2 / BTC correlation framework (Chapter 8)
- ETF demand elasticity (no live feed wired)
- Regulatory catalyst tracking (no live feed wired)
Influence Framework (Categories only · Coming after ledger sample)
- Volume confirmation on closed candles (live, see Live Market panel above)
- Derivatives — funding rate, open interest (live or via
data/public/derivatives.json) - ETF / institutional flows (no live feed wired into this page)
- Macro context — DXY, M2, Fed policy (research chapters only)
- Sentiment — Fear & Greed, retail positioning (no live feed wired into this page)
Ledger Feed (Real events from the public forecast ledger)
Volatility / Volume Awareness Score (Derived · not a measured signal)
IQ Growth Timeline
Trust & Transparency
Every metric below is sourced from a public artifact in this repo. When a backing artifact is missing or its sample size is below the display threshold, the panel shows an explicit initializing or insufficient data state instead of a number. This page is educational research and not financial advice.
- Ledger-backed metrics only. Hit-rate / Brier / log-loss numbers are computed from ledger/public/accuracy.json, which is generated from append-only forecast and resolution streams. No author-set hit rates appear in the measured panels.
- Sample-size aware. Until at least n=20 forecasts are resolved, accuracy is reported as insufficient data. Rolling windows (7d / 30d / 90d) are shown only when each window meets its own minimum.
- Models run in shadow mode. All models in models/public/registry.json are gated by the Phase 4 promotion criteria (resolved-per-horizon ≥ 30, shadow days ≥ 14, ECE ≤ 0.08, must beat baseline Brier, manual approval). Until those gates pass, their forecasts are recorded but never shown as “live”.
- Source freshness, not just price. Every data feed exposes a freshness budget in data/public/source_health.json; panels stamp themselves stale when their source is past budget.
- Confidence intervals are not fabricated. Probability bands appear only when generated by a valid calibration artifact. Otherwise the field reads unavailable.
- Daily briefings. The archive renders only artifacts that exist on disk. No email or external delivery integration is claimed unless its artifact is present.
- Hub status: not yet integrated. Cross-site HUB readiness (Phase 5) is being built in a separate repository and is not yet merged here. Any HUB-dependent panel will show not connected until that work lands.
- Not financial advice. Do not size positions or allocate capital based on anything shown here.
Source Freshness
Model Version & Status
Forecast Confidence Intervals
Prediction History
Daily Briefing Archive
One email a week: the ledger's live hit-rate vs. baseline, regime shifts, and what changed in the models. Join now — you'll get the first issue when delivery goes live.
The deal: a paid tier only opens if and when the public accuracy ledger above beats its baseline out of sample. Until then, everything here stays free. Not financial advice.
New to Bitcoin? Read this first.
Five minutes, no jargon, no hype — what Bitcoin is, why people care, and how to use this site to actually learn.
What is Bitcoin?
Bitcoin is digital money that no company, bank, or government controls. Instead of a bank keeping the record of who owns what, thousands of computers around the world keep identical copies of one shared record (the blockchain), and they constantly check each other. To cheat, you would have to fool most of them at once — which is what makes the record trustworthy without needing a boss.
Why do people care?
Two reasons. First, scarcity: the rulebook says only 21 million bitcoins will ever exist, and nobody can change that without convincing the whole network. Regular money can be printed in unlimited amounts; Bitcoin cannot. Second, permission-free: anyone with a phone can receive or send it, anywhere on Earth, without asking a bank for an account. Whether those two properties make it valuable is exactly what the market argues about every day — that argument is the price chart.
Why does the price jump around so much?
Because nobody knows what it "should" be worth, the price is pure supply and demand — global, 24/7, amplified by borrowed money and emotion. Bitcoin has climbed thousands of percent and it has crashed by more than half many times (see Chapter 2 and Chapter 4). Both are normal for this asset.
- This site is for learning. It is not financial advice, and nothing here tells you to buy or sell anything.
- If you are young: the smartest thing you can do with Bitcoin right now is understand it. Knowledge compounds and can't crash.
- Nobody — including us — reliably predicts Bitcoin's price. Our own public scoreboard proves how hard it is: check the Forecast Scoreboard, where we publish every guess we make, including the wrong ones.
- Never put in money you can't afford to lose completely. People who ignore this rule fund the lessons everyone else learns for free.
The halving — Bitcoin's built-in clock, interactive
New bitcoins are created as a reward to the computers that secure the network (mining). Roughly every four years that reward is cut in half — so new supply keeps slowing until it stops entirely around the year 2140. Drag the slider to watch the schedule play out:
How to use this site
Two ways in, depending on what you want:
- Learn how Bitcoin works — read the chapters in order. The 10-minute path: Fundamentals → Halving Cycles → Bull & Bear Markets → Risk Management. Then test yourself. Dotted-underlined words show definitions when you hover or tap them.
- See the live data — the Live Market Command Center shows what the market is doing right now, and the Forecast Scoreboard shows how our prediction experiments are actually going, measured in public.
Every chapter starts with an "In plain words" box — if the full text feels heavy, the boxes alone tell the story.
Fundamentals
Core protocol parameters and network statistics.
Price History
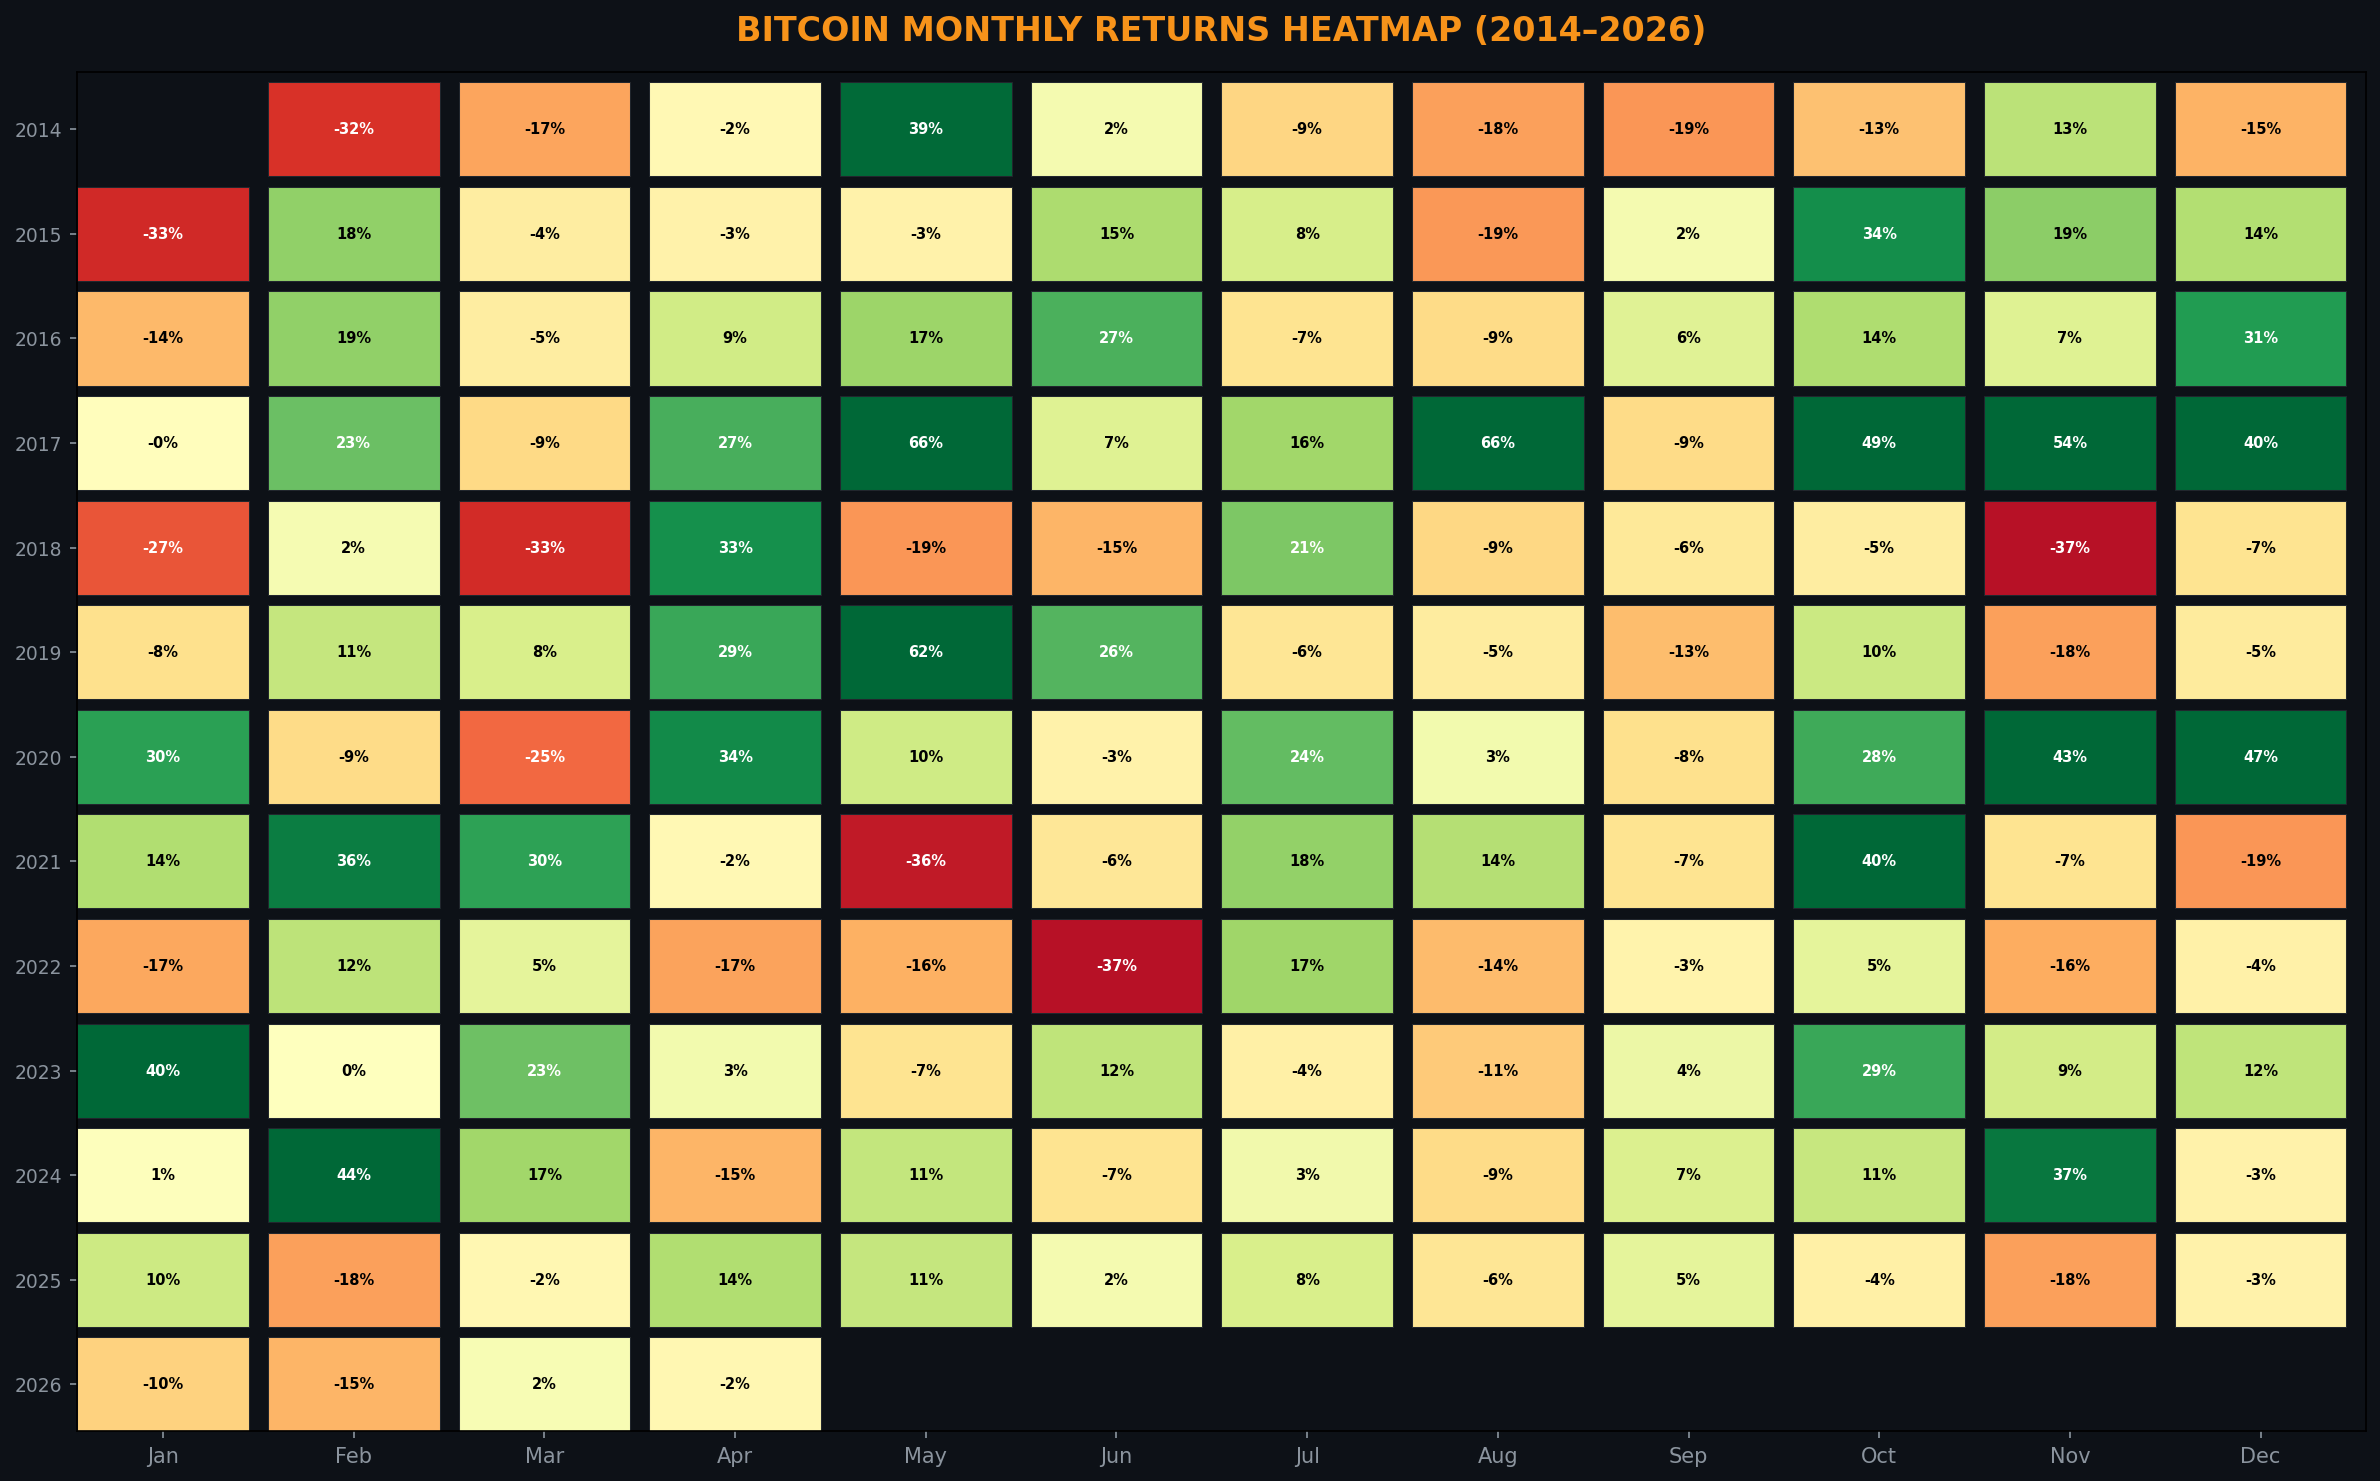
Bitcoin price evolution and annual return analysis.
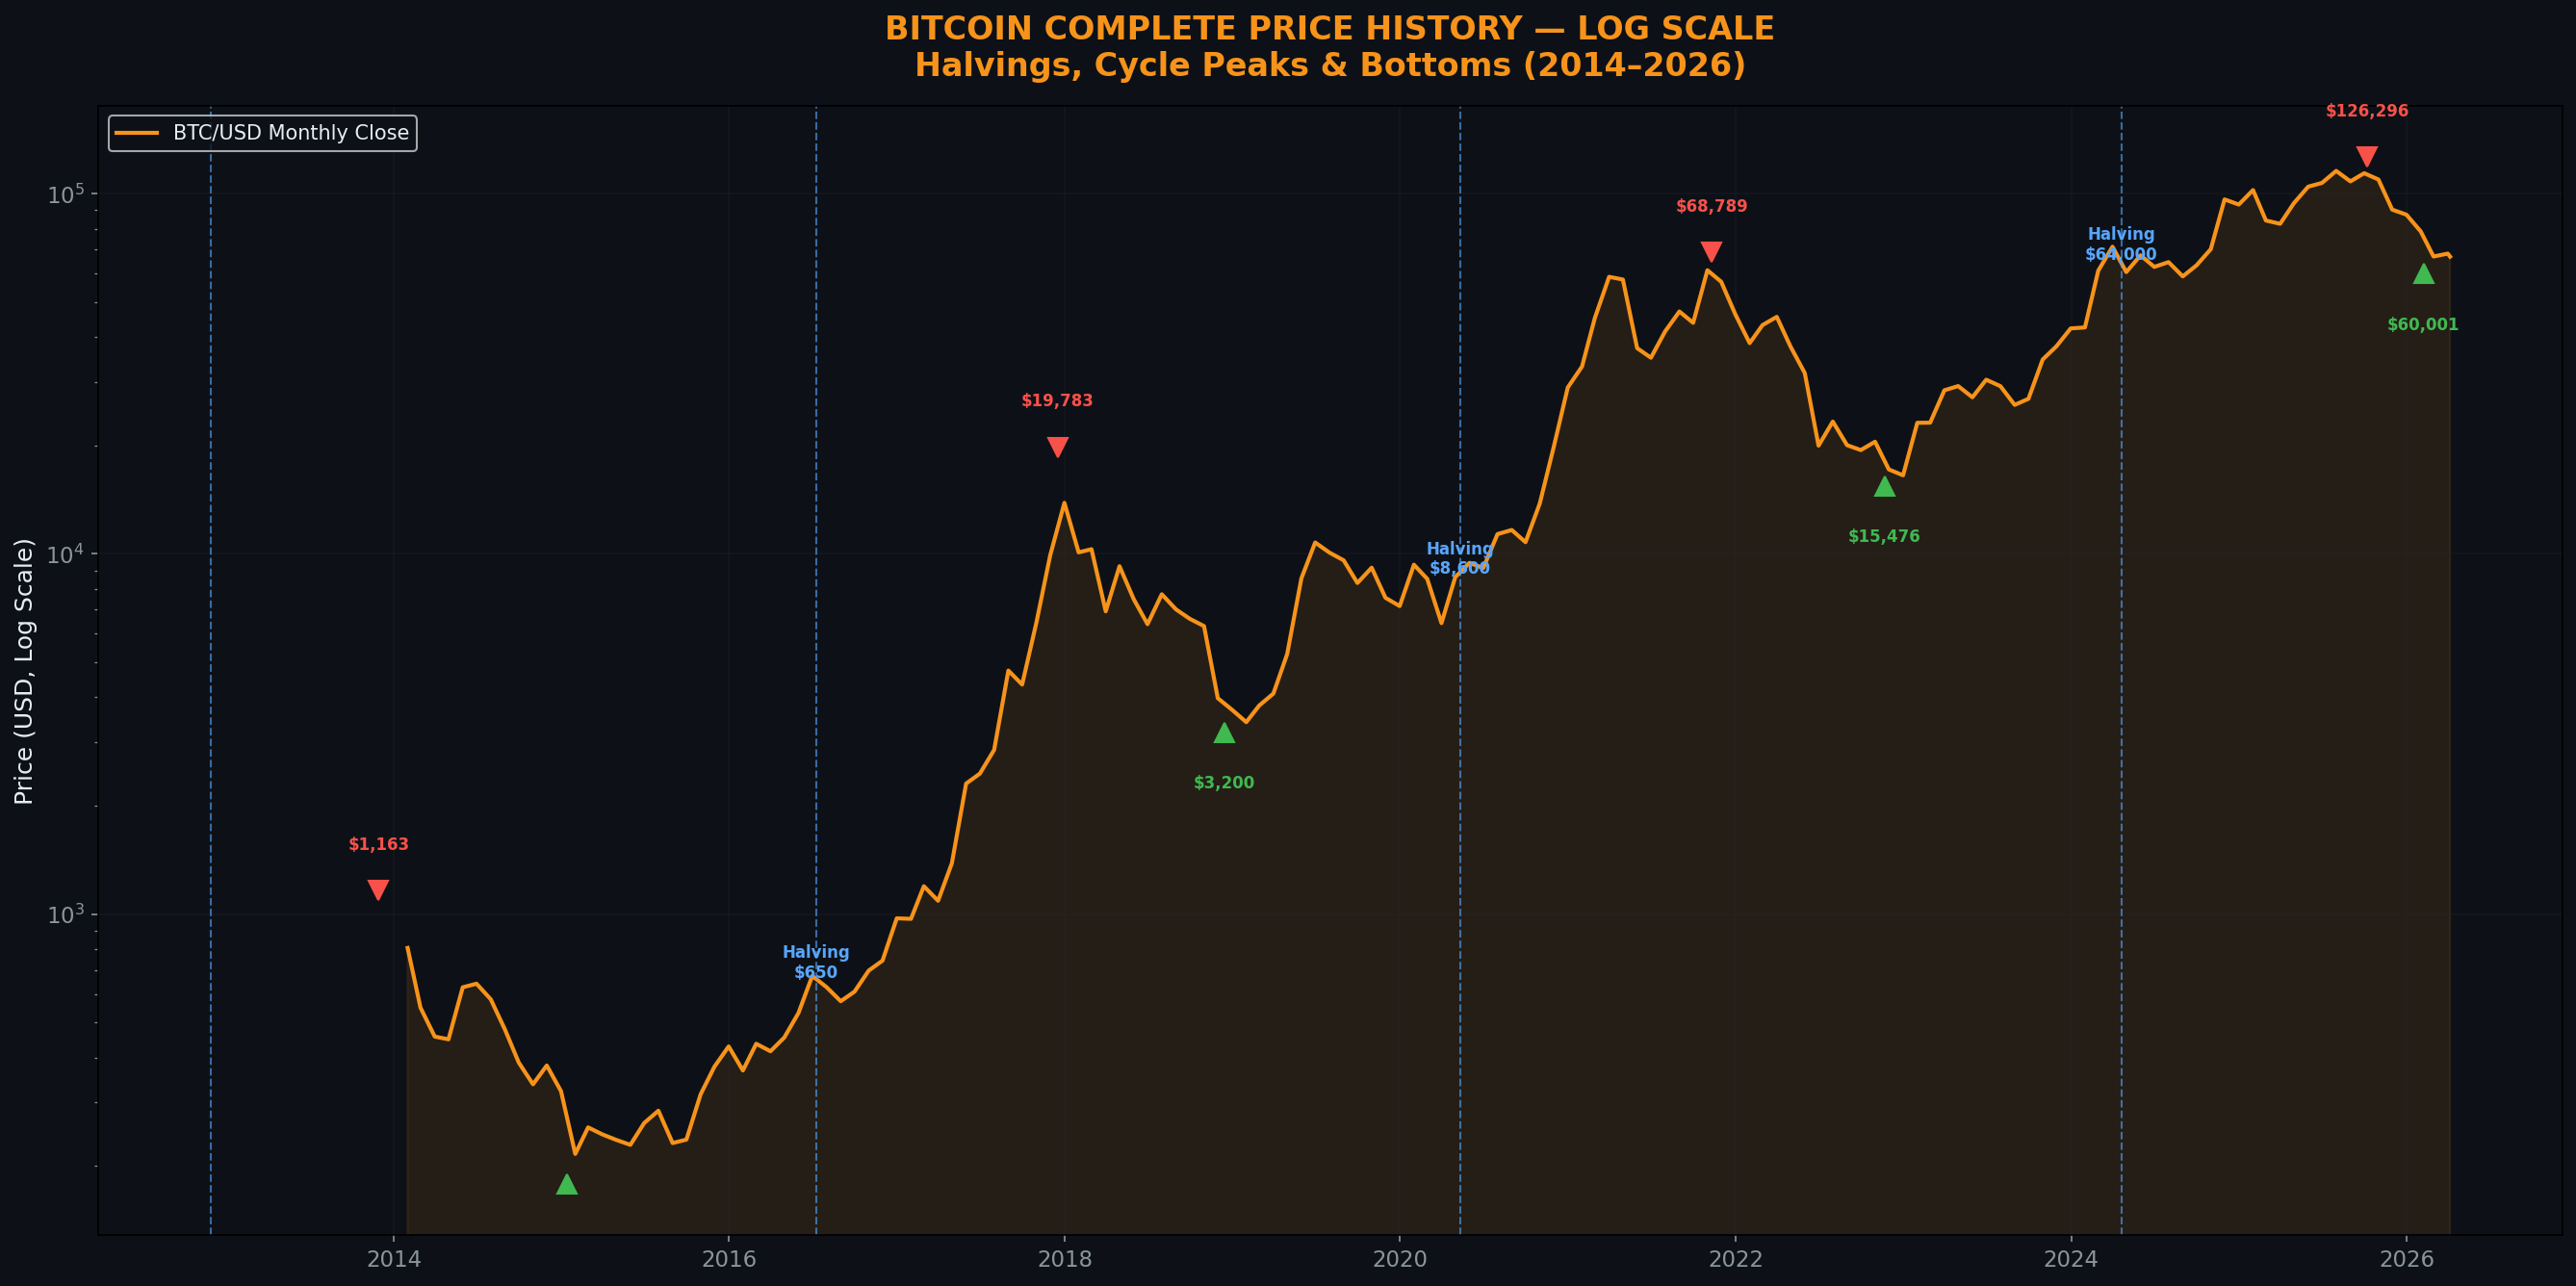
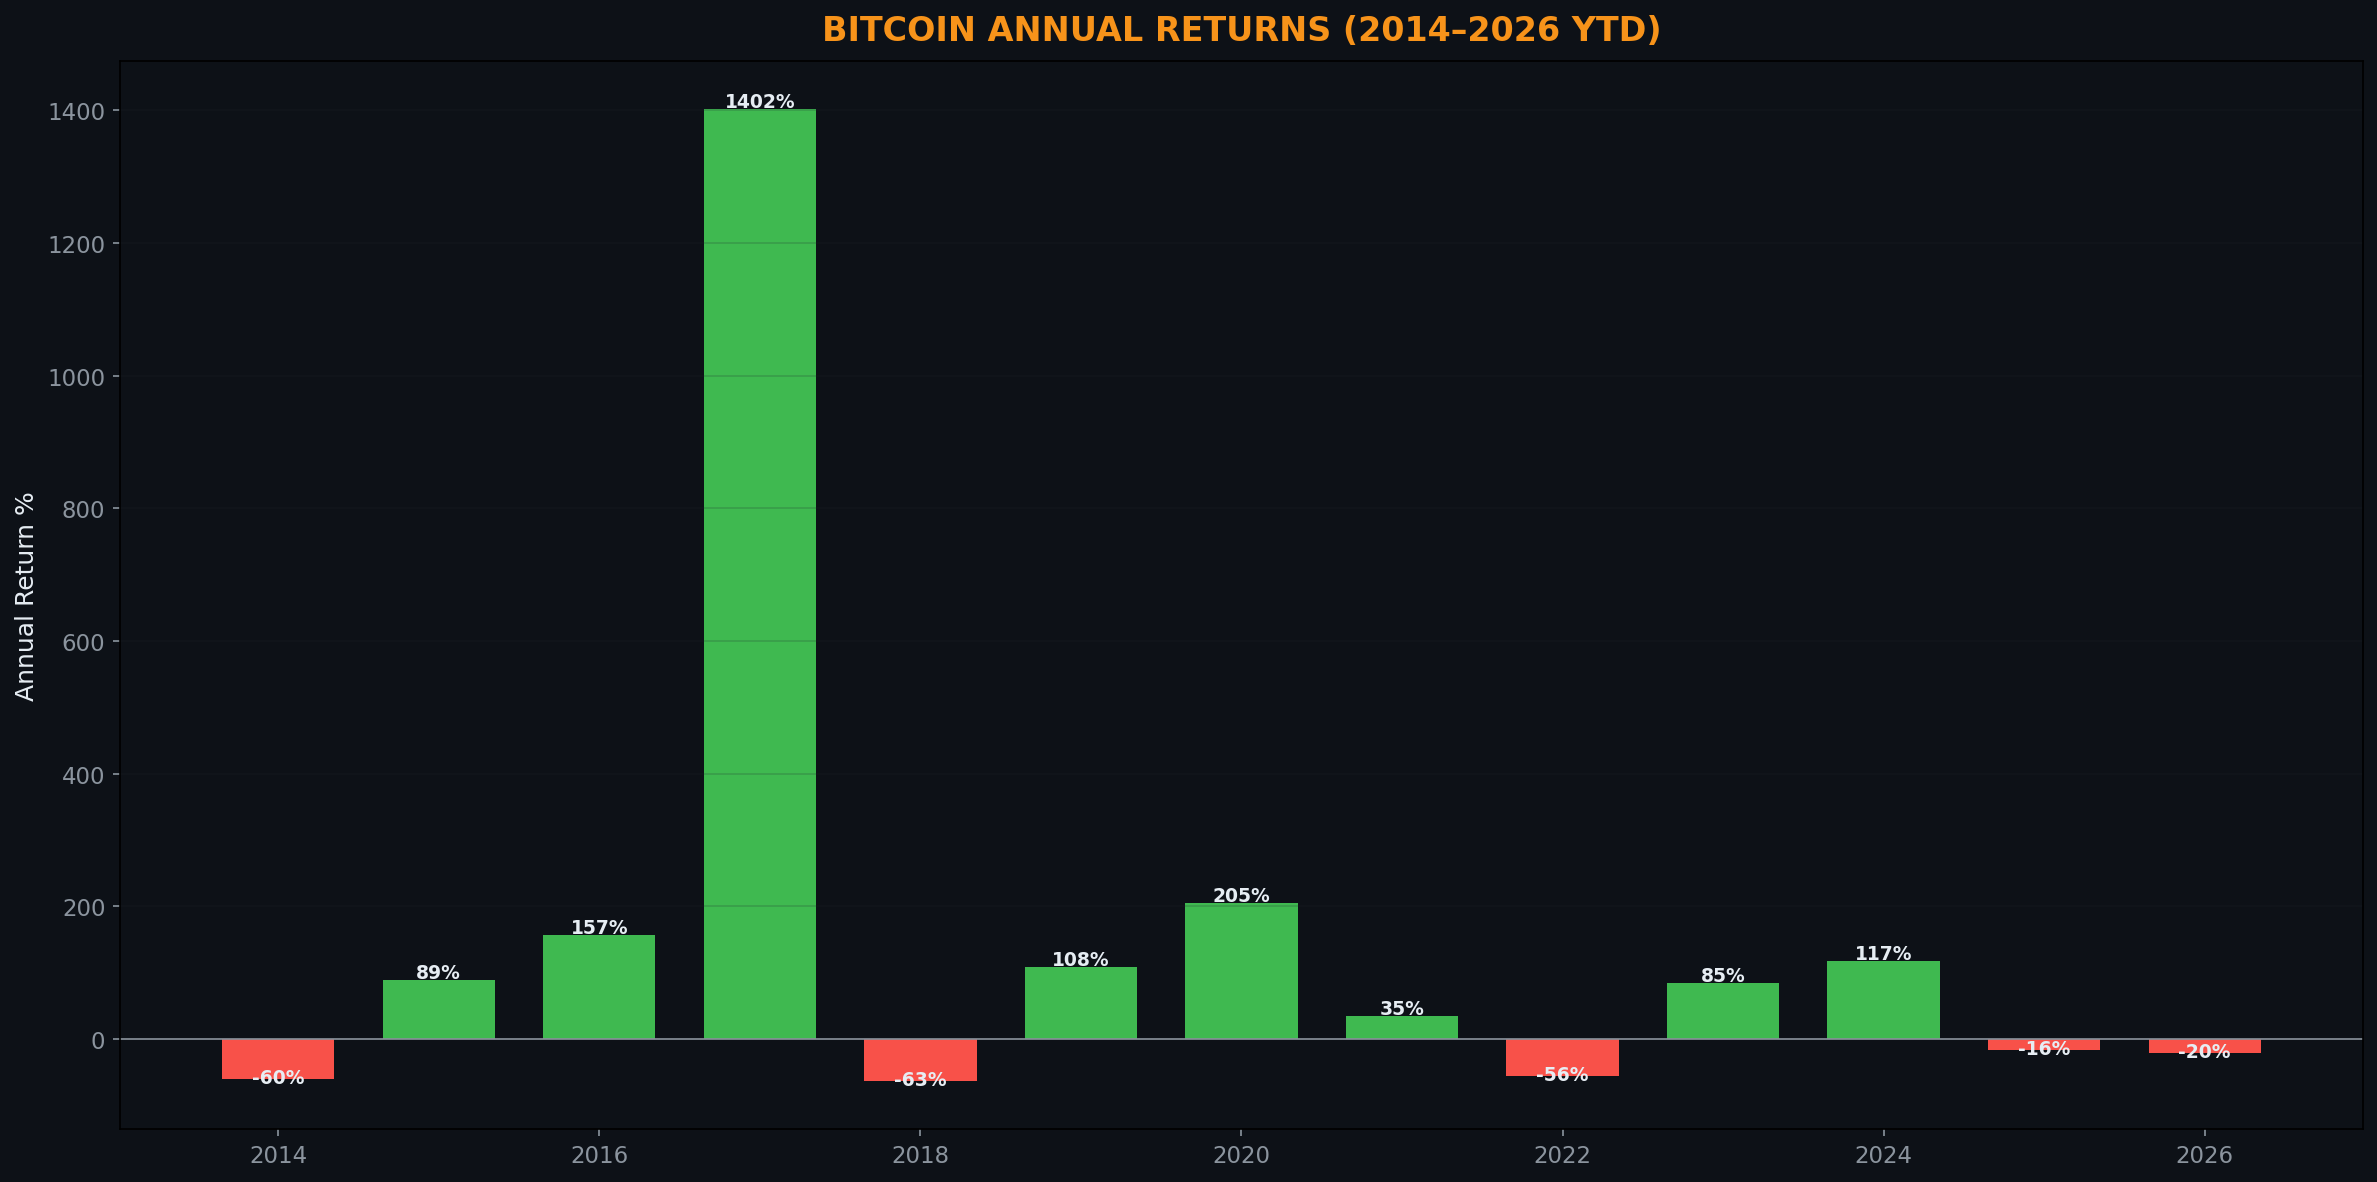
Yearly Returns (2014–2026)
| Year | Return | Year | Return | Year | Return |
|---|---|---|---|---|---|
| 2014 | -58% | 2019 | +95% | 2024 | +121% |
| 2015 | +35% | 2020 | +305% | 2025 | +5% |
| 2016 | +125% | 2021 | +60% | 2026 YTD | -23% |
| 2017 | +1,369% | 2022 | -64% | ||
| 2018 | -73% | 2023 | +155% |
Halving Cycles
Complete halving cycle framework across all four Bitcoin epochs.
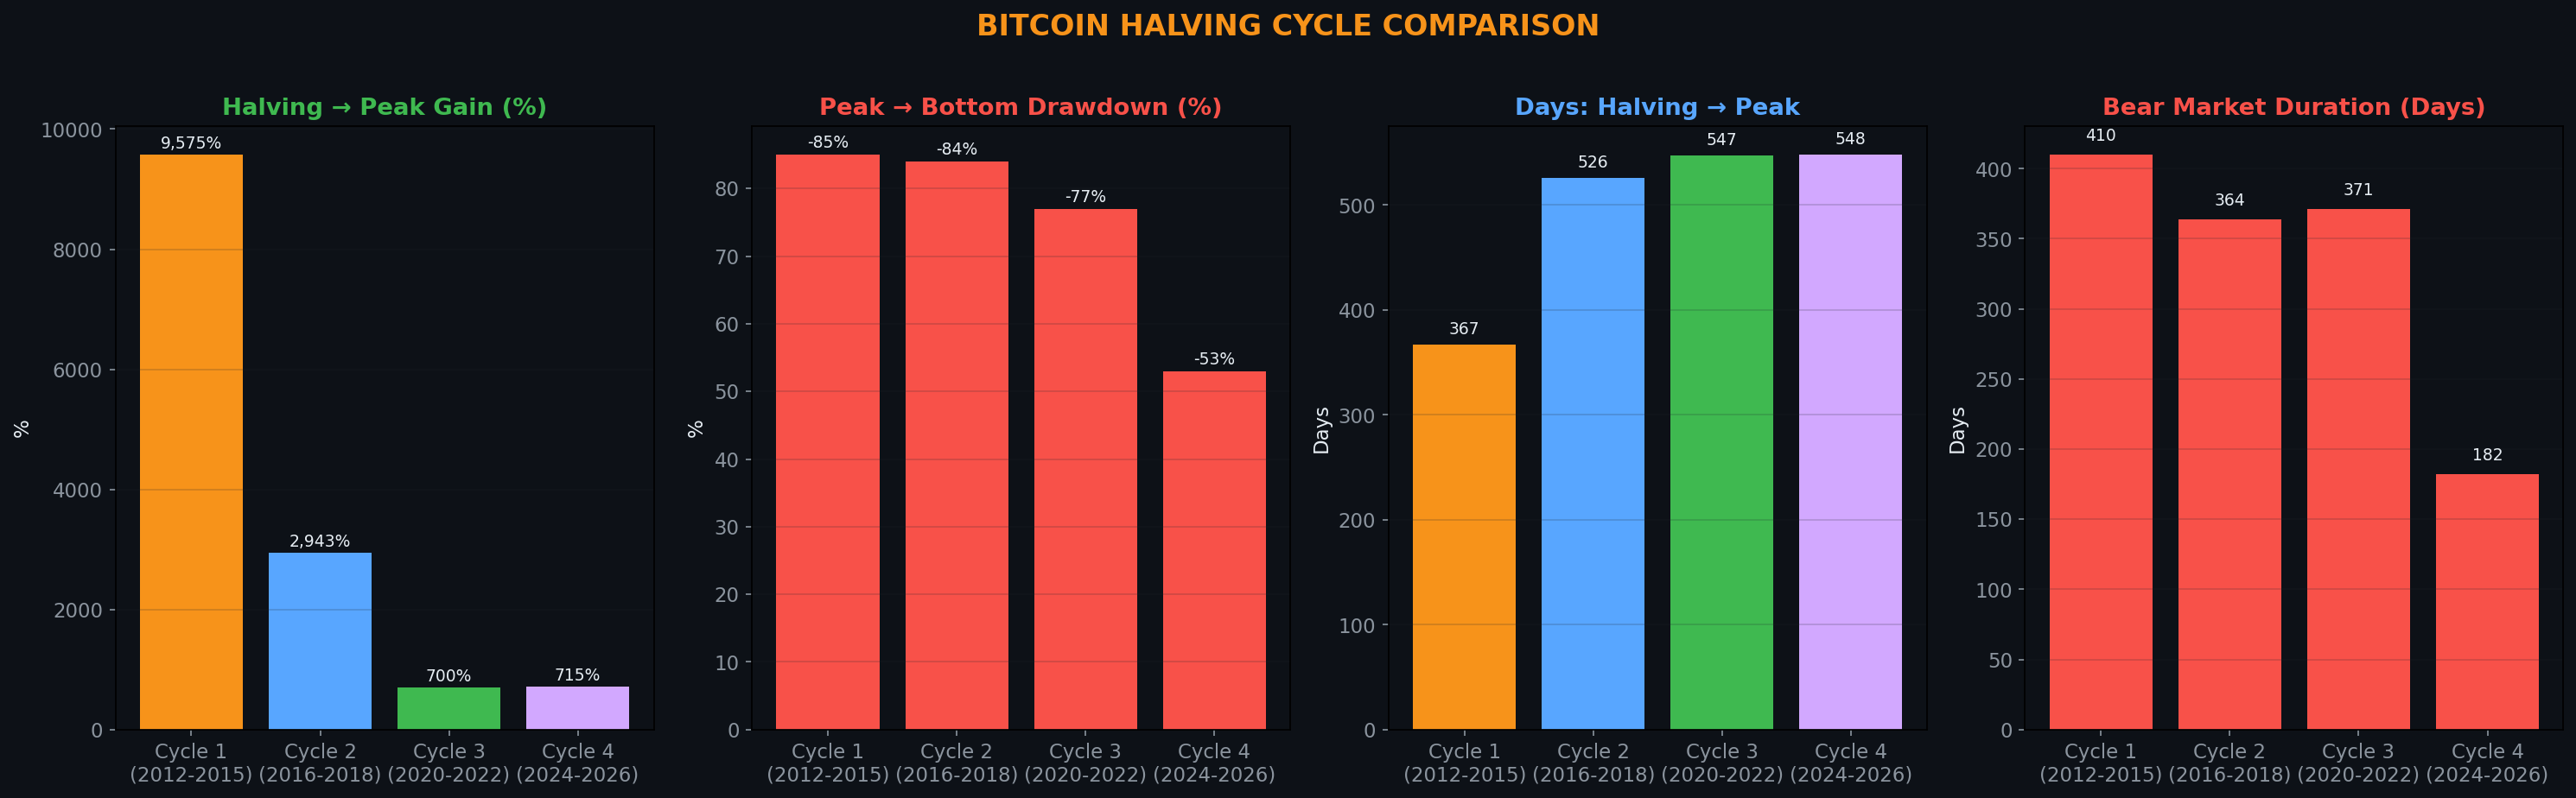
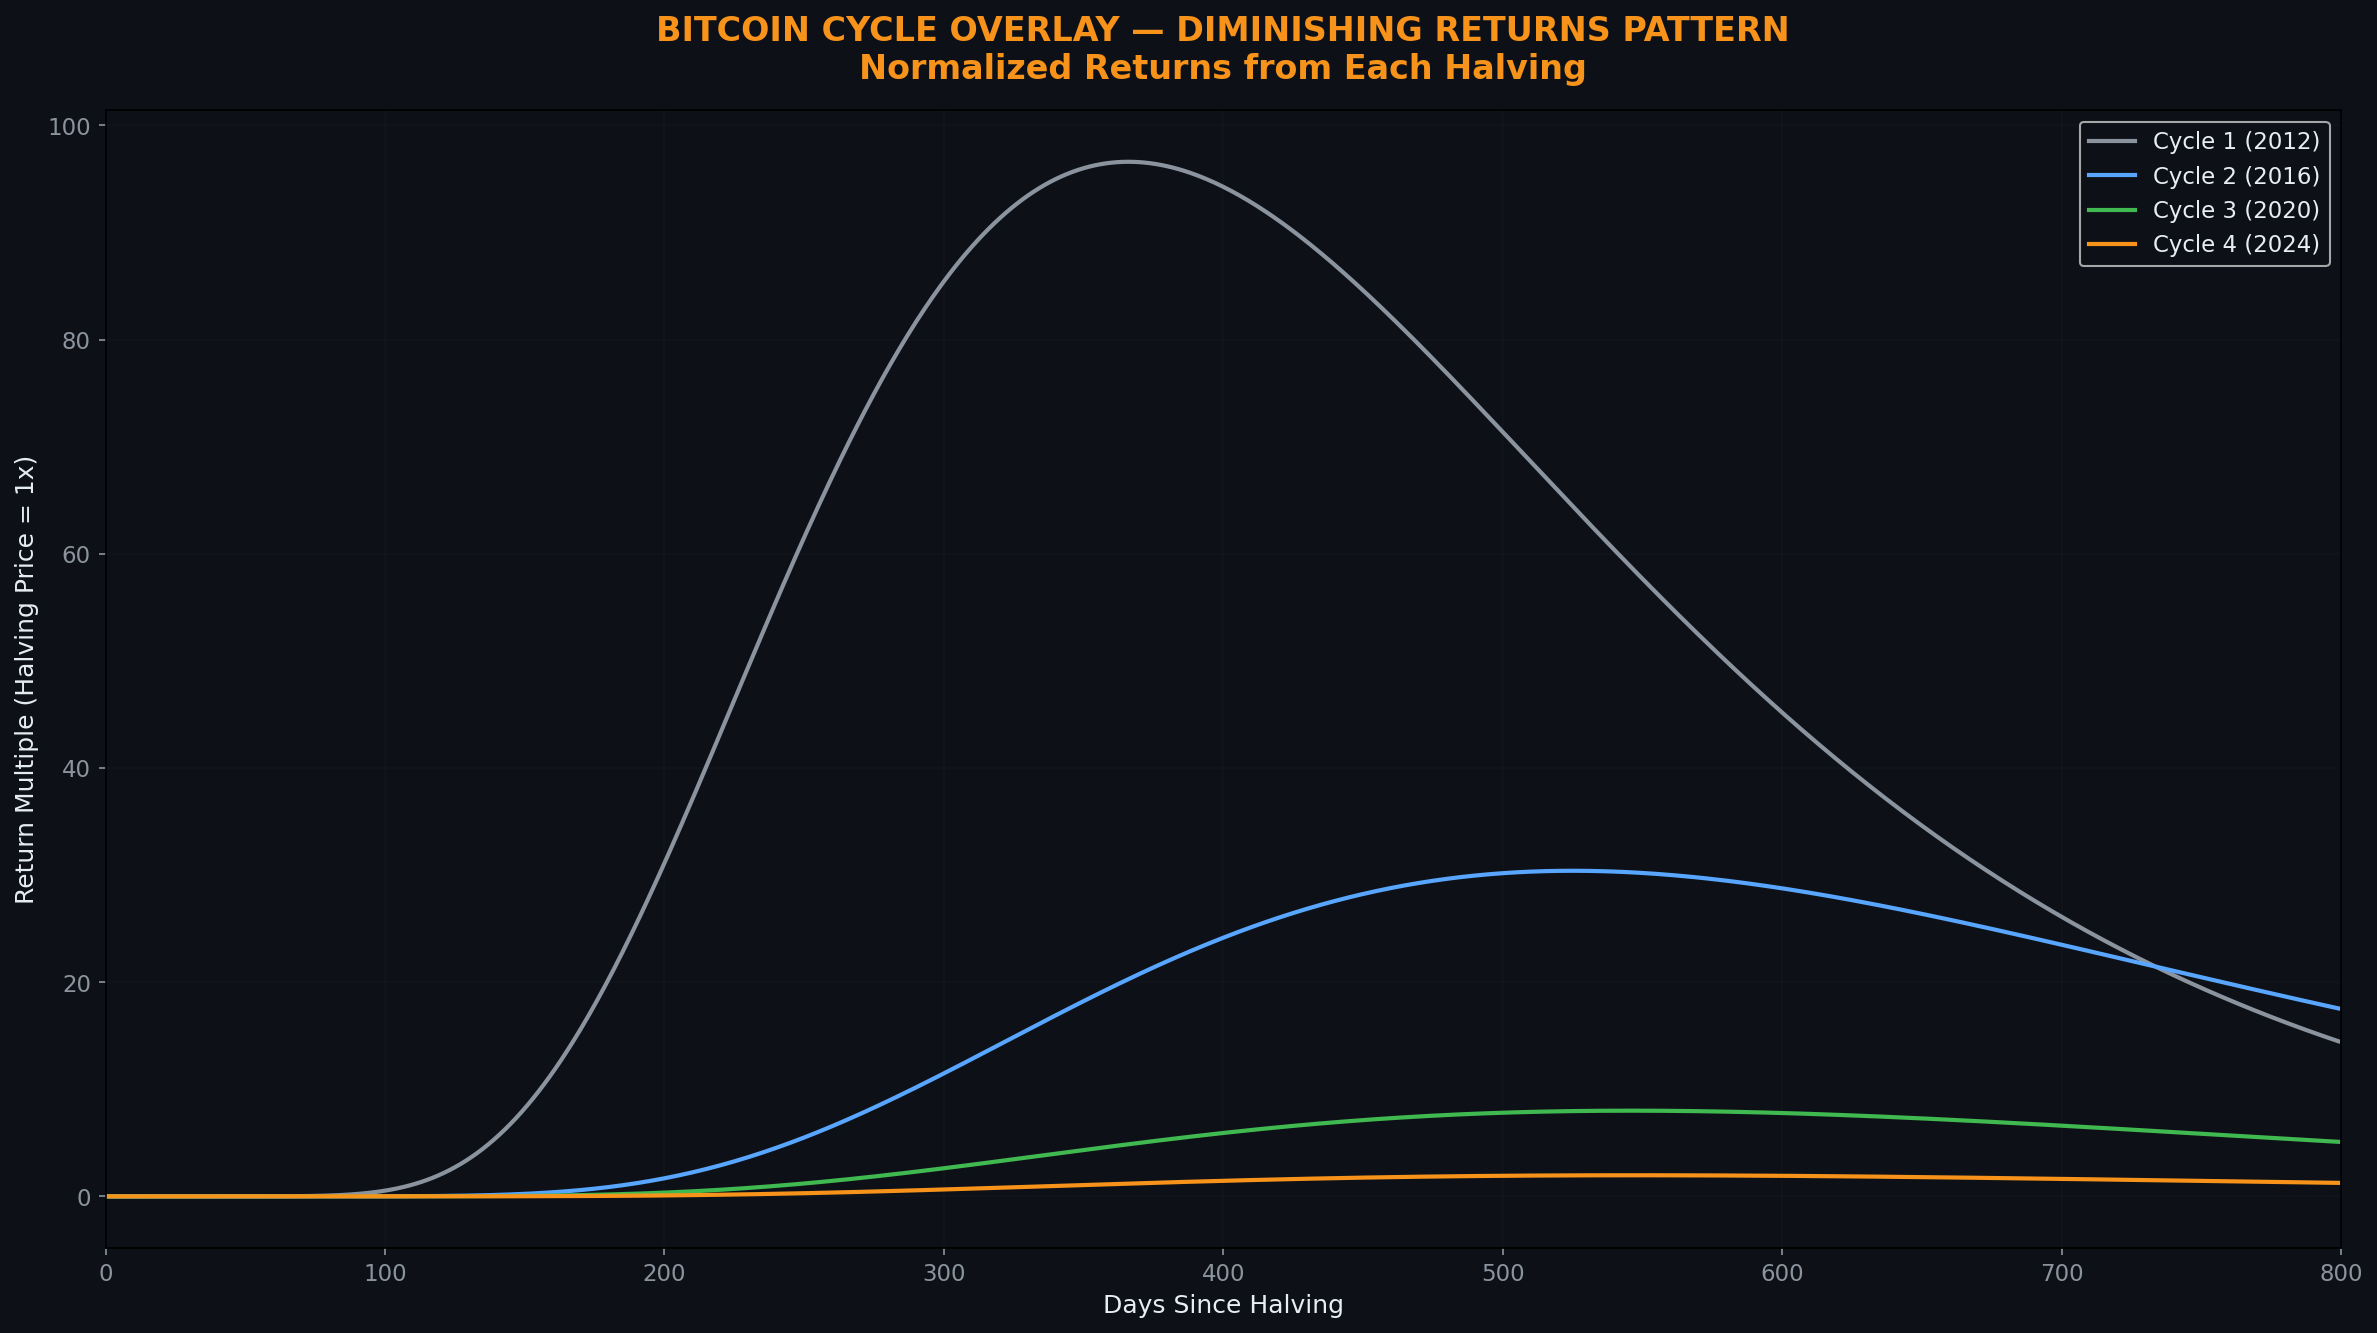
Halving Data Across All Epochs
| Halving | Date | Block Reward | Price at Halving | Cycle Peak | Peak Date | Days to Peak | Gain % | Drawdown % |
|---|---|---|---|---|---|---|---|---|
| 1st | Nov 28, 2012 | 50→25 BTC | $12 | $1,163 | Nov 29, 2013 | 367 | 9,575% | -85% |
| 2nd | Jul 9, 2016 | 25→12.5 BTC | $650 | $19,783 | Dec 17, 2017 | 526 | 2,943% | -84% |
| 3rd | May 11, 2020 | 12.5→6.25 BTC | $8,600 | $68,789 | Nov 10, 2021 | 547 | 700% | -77% |
| 4th | Apr 19, 2024 | 6.25→3.125 BTC | $64,000 | $126,296 | Oct 6, 2025 | 548 | 715% | -53%* |
*ongoing — drawdown may deepen
Bull & Bear Markets
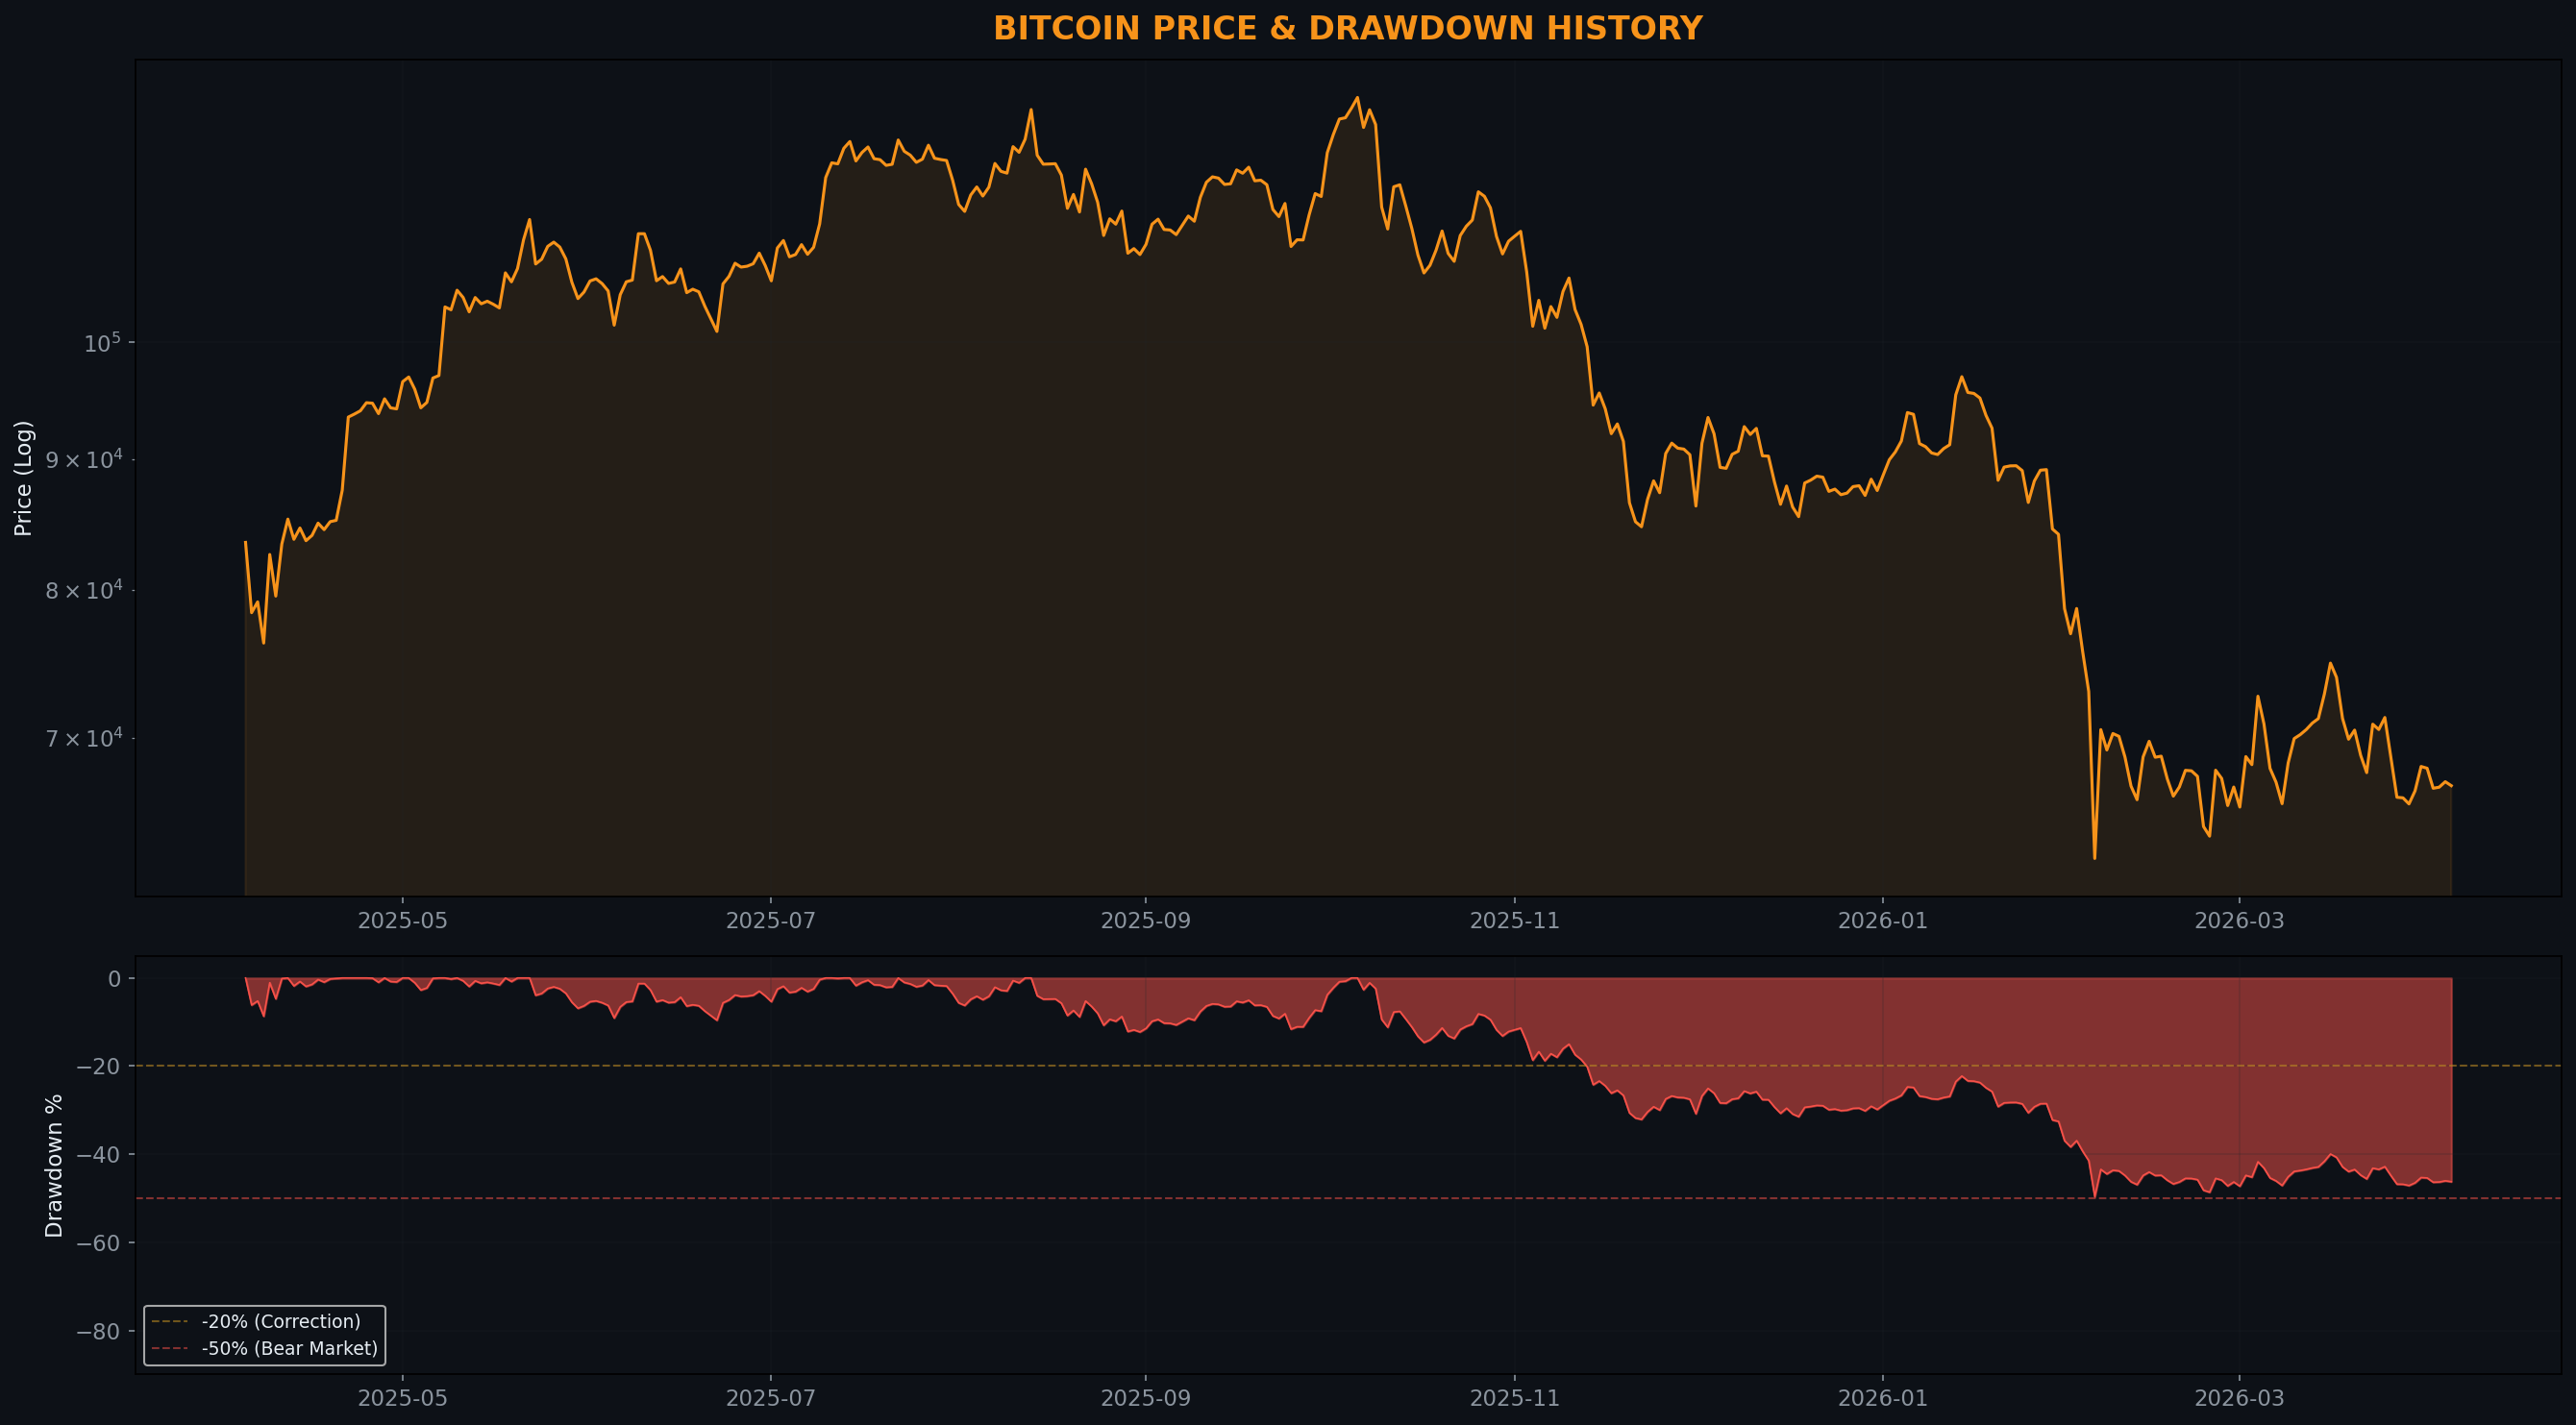
Historical bear market analysis and structural patterns.
Major Bear Markets
| Bear Market | Start | End | Duration | Drawdown |
|---|---|---|---|---|
| 2014–2015 | Dec 2013 | Jan 2015 | 410 days | -85% |
| 2018 | Dec 2017 | Dec 2018 | 364 days | -84% |
| 2022 | Nov 2021 | Nov 2022 | 371 days | -77% |
| 2025–26 | Oct 2025 | Ongoing | 182+ days | -53% |
Technical Analysis
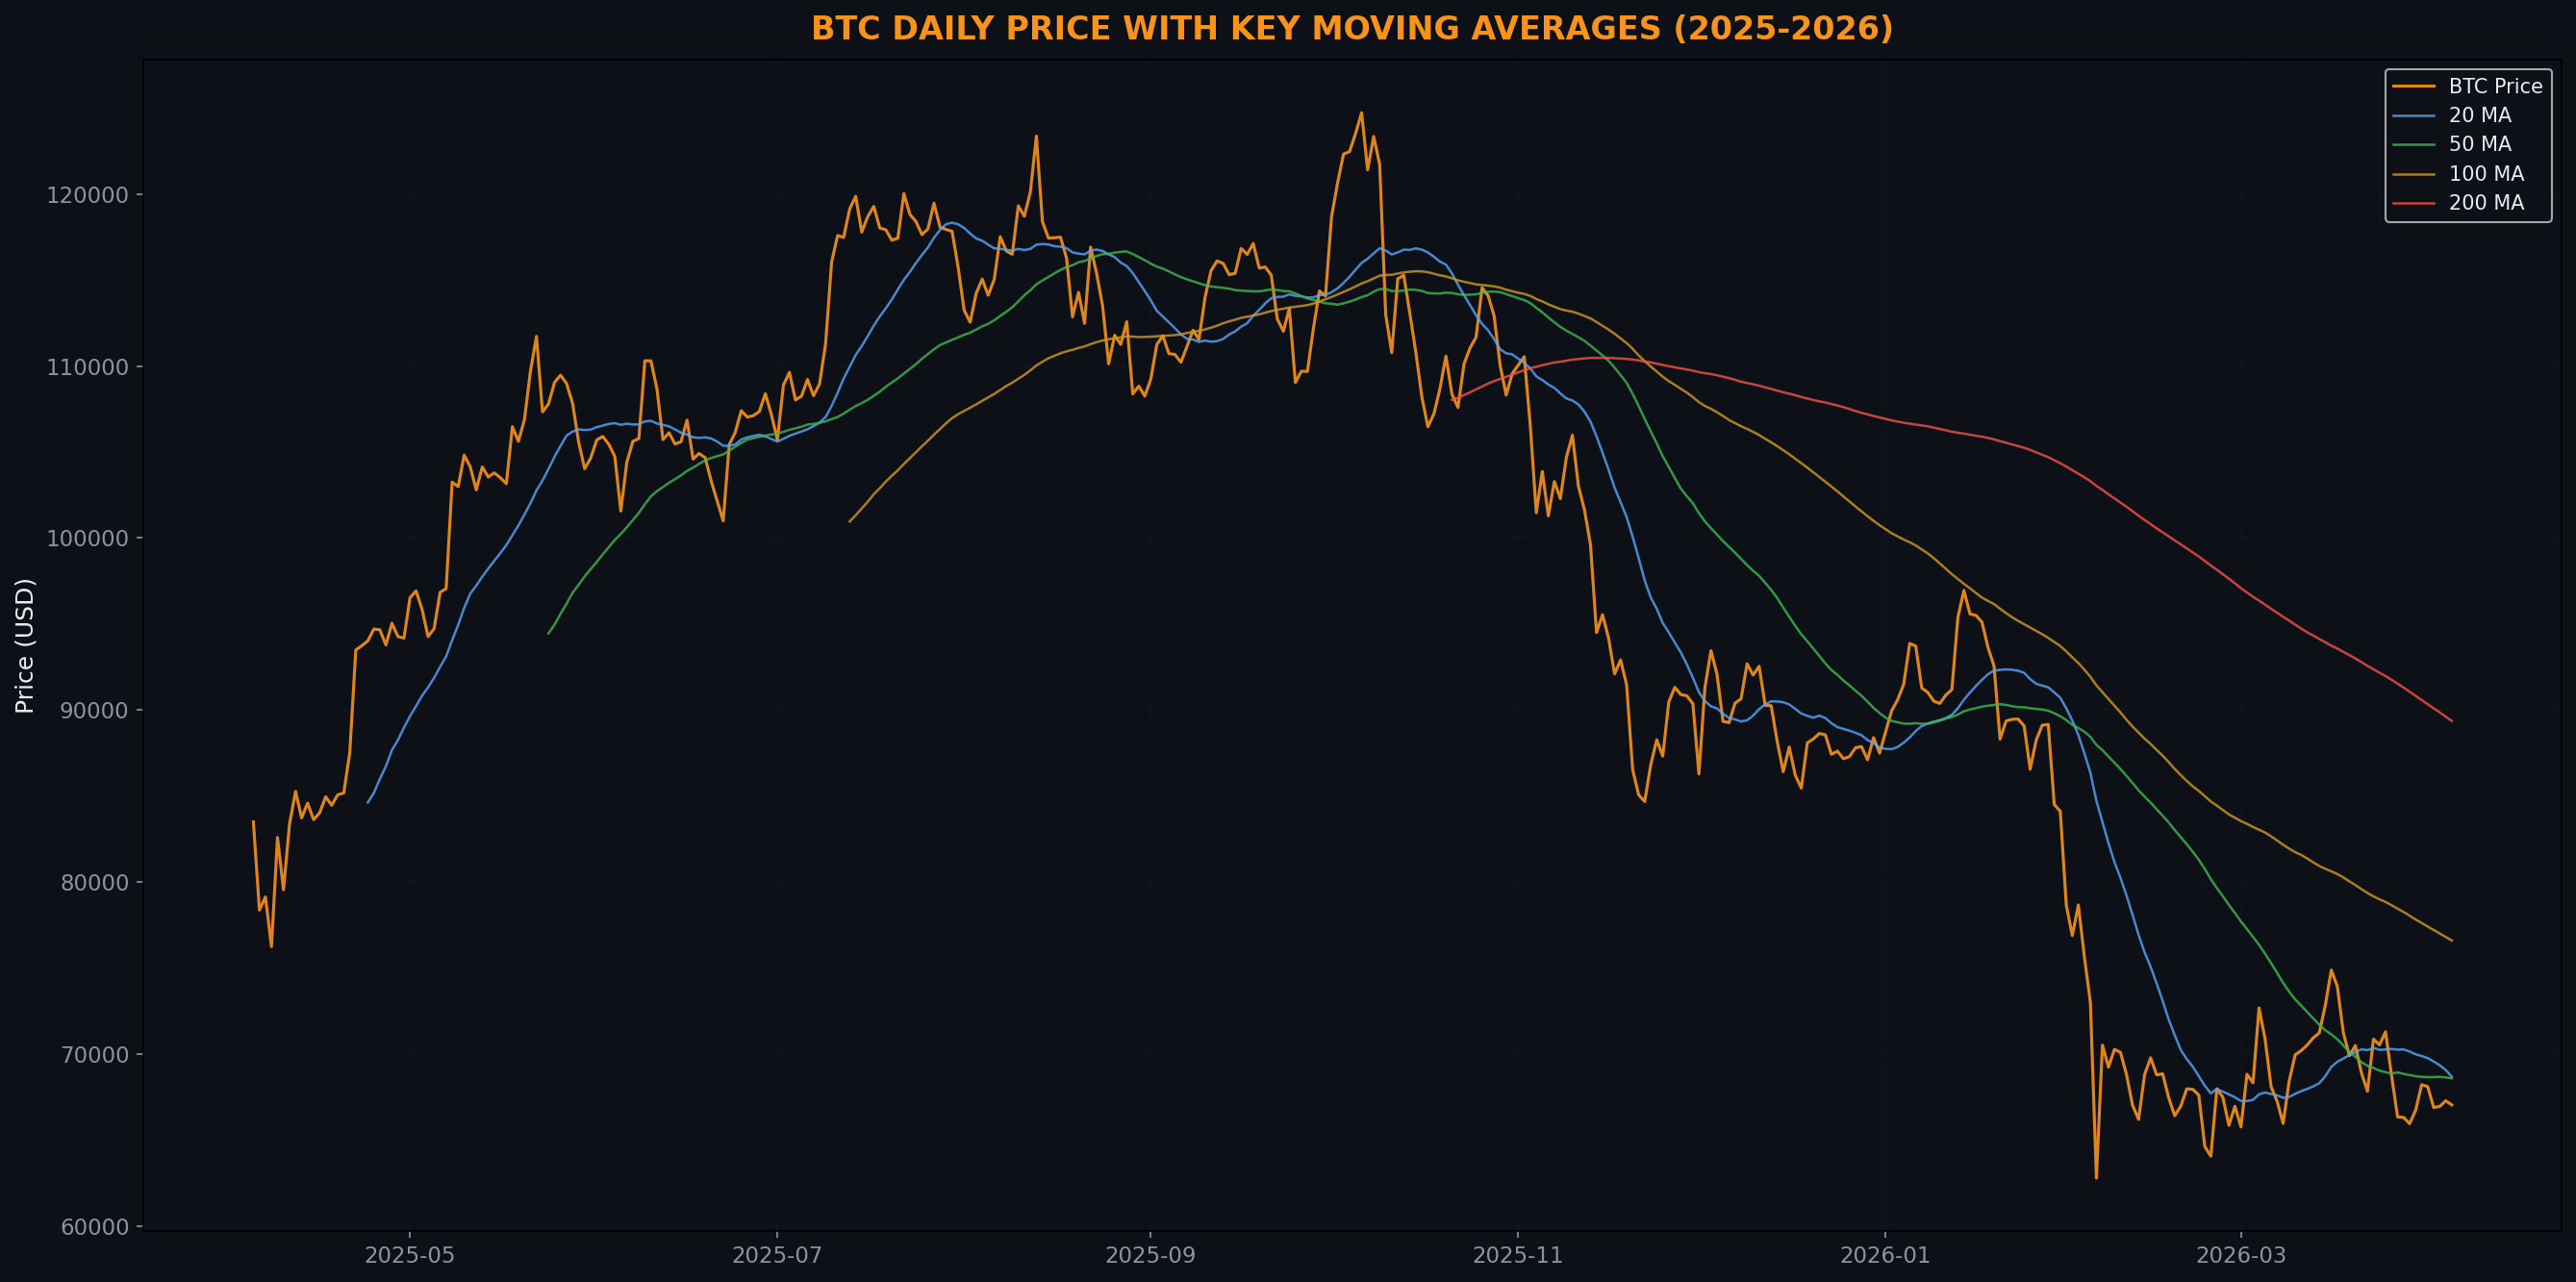
Pattern reliability, moving averages, and key technical frameworks.
Pattern Reliability on BTC
| Pattern | BTC Win Rate | Notes |
|---|---|---|
| Head & Shoulders | 63% | Reliable at macro tops |
| Double Bottom | 72% | Strong at cycle lows |
| Bull Flag | 67% | Works in confirmed uptrends |
| Ascending Triangle | 65% | Breakout above resistance |
| Falling Wedge | 68% | Bullish reversal pattern |
On-Chain Metrics
Key blockchain-native valuation indicators and their zone frameworks.
MVRV Ratio (Market Value to Realized Value)
NUPL (Net Unrealized Profit/Loss)
Puell Multiple
Reserve Risk
Sentiment
Fear & Greed Index extremes and their predictive power.
Fear & Greed Extremes — Historical Outcomes
| Date | Reading | Category | BTC Price | 6-Month After |
|---|---|---|---|---|
| Mar 2020 | 8 | Extreme Fear | $5,000 | +232% |
| Jun 2022 | 6 | Extreme Fear | $17,600 | +38% |
| Feb 2026 | 5 | Extreme Fear | $60,001 | TBD |
| Nov 2021 | 84 | Extreme Greed | $69,000 | -67% |
| Oct 2025 | 90 | Extreme Greed | $126,000 | -47% |
Macro Correlations
Cross-asset relationships, institutional flows, and ETF impact.
Cross-Asset Correlation Matrix
| Asset | Bull Market Corr. | Bear Market Corr. | Notes |
|---|---|---|---|
| S&P 500 | 0.40–0.70 | 0.60–0.87 | Highest during risk-off |
| Nasdaq | 0.50–0.80 | 0.70–0.87 | Strongest tech correlation |
| Gold | 0.10–0.40 | -0.20–0.30 | Diverged sharply in 2025 |
| DXY | -0.30–(-0.60) | -0.40–(-0.70) | Inverse most of the time |
Black Swan Events
Critical disruption events and their market impact.
Mt. Gox Collapse
850,000 BTC stolen from the world's largest exchange, exposing catastrophic custodial risk.
COVID Black Thursday
Global liquidity crisis triggered a -53% crash in 24 hours, followed by a historic V-shaped recovery.
Terra/LUNA Death Spiral
Algorithmic stablecoin UST depegged, destroying $60B in value and triggering cascading liquidations across DeFi.
FTX Collapse
Exchange fraud exposed, leading to bankruptcy. BTC hit $15,476 cycle low — peak fear, peak opportunity.
SVB Banking Crisis
Silicon Valley Bank failure sparked fears of systemic banking contagion. BTC rallied as safe-haven narrative validated.
Spot ETF Approval
SEC approved 11 spot Bitcoin ETFs, opening historic institutional access and fundamentally changing the market structure.
Trading Strategies
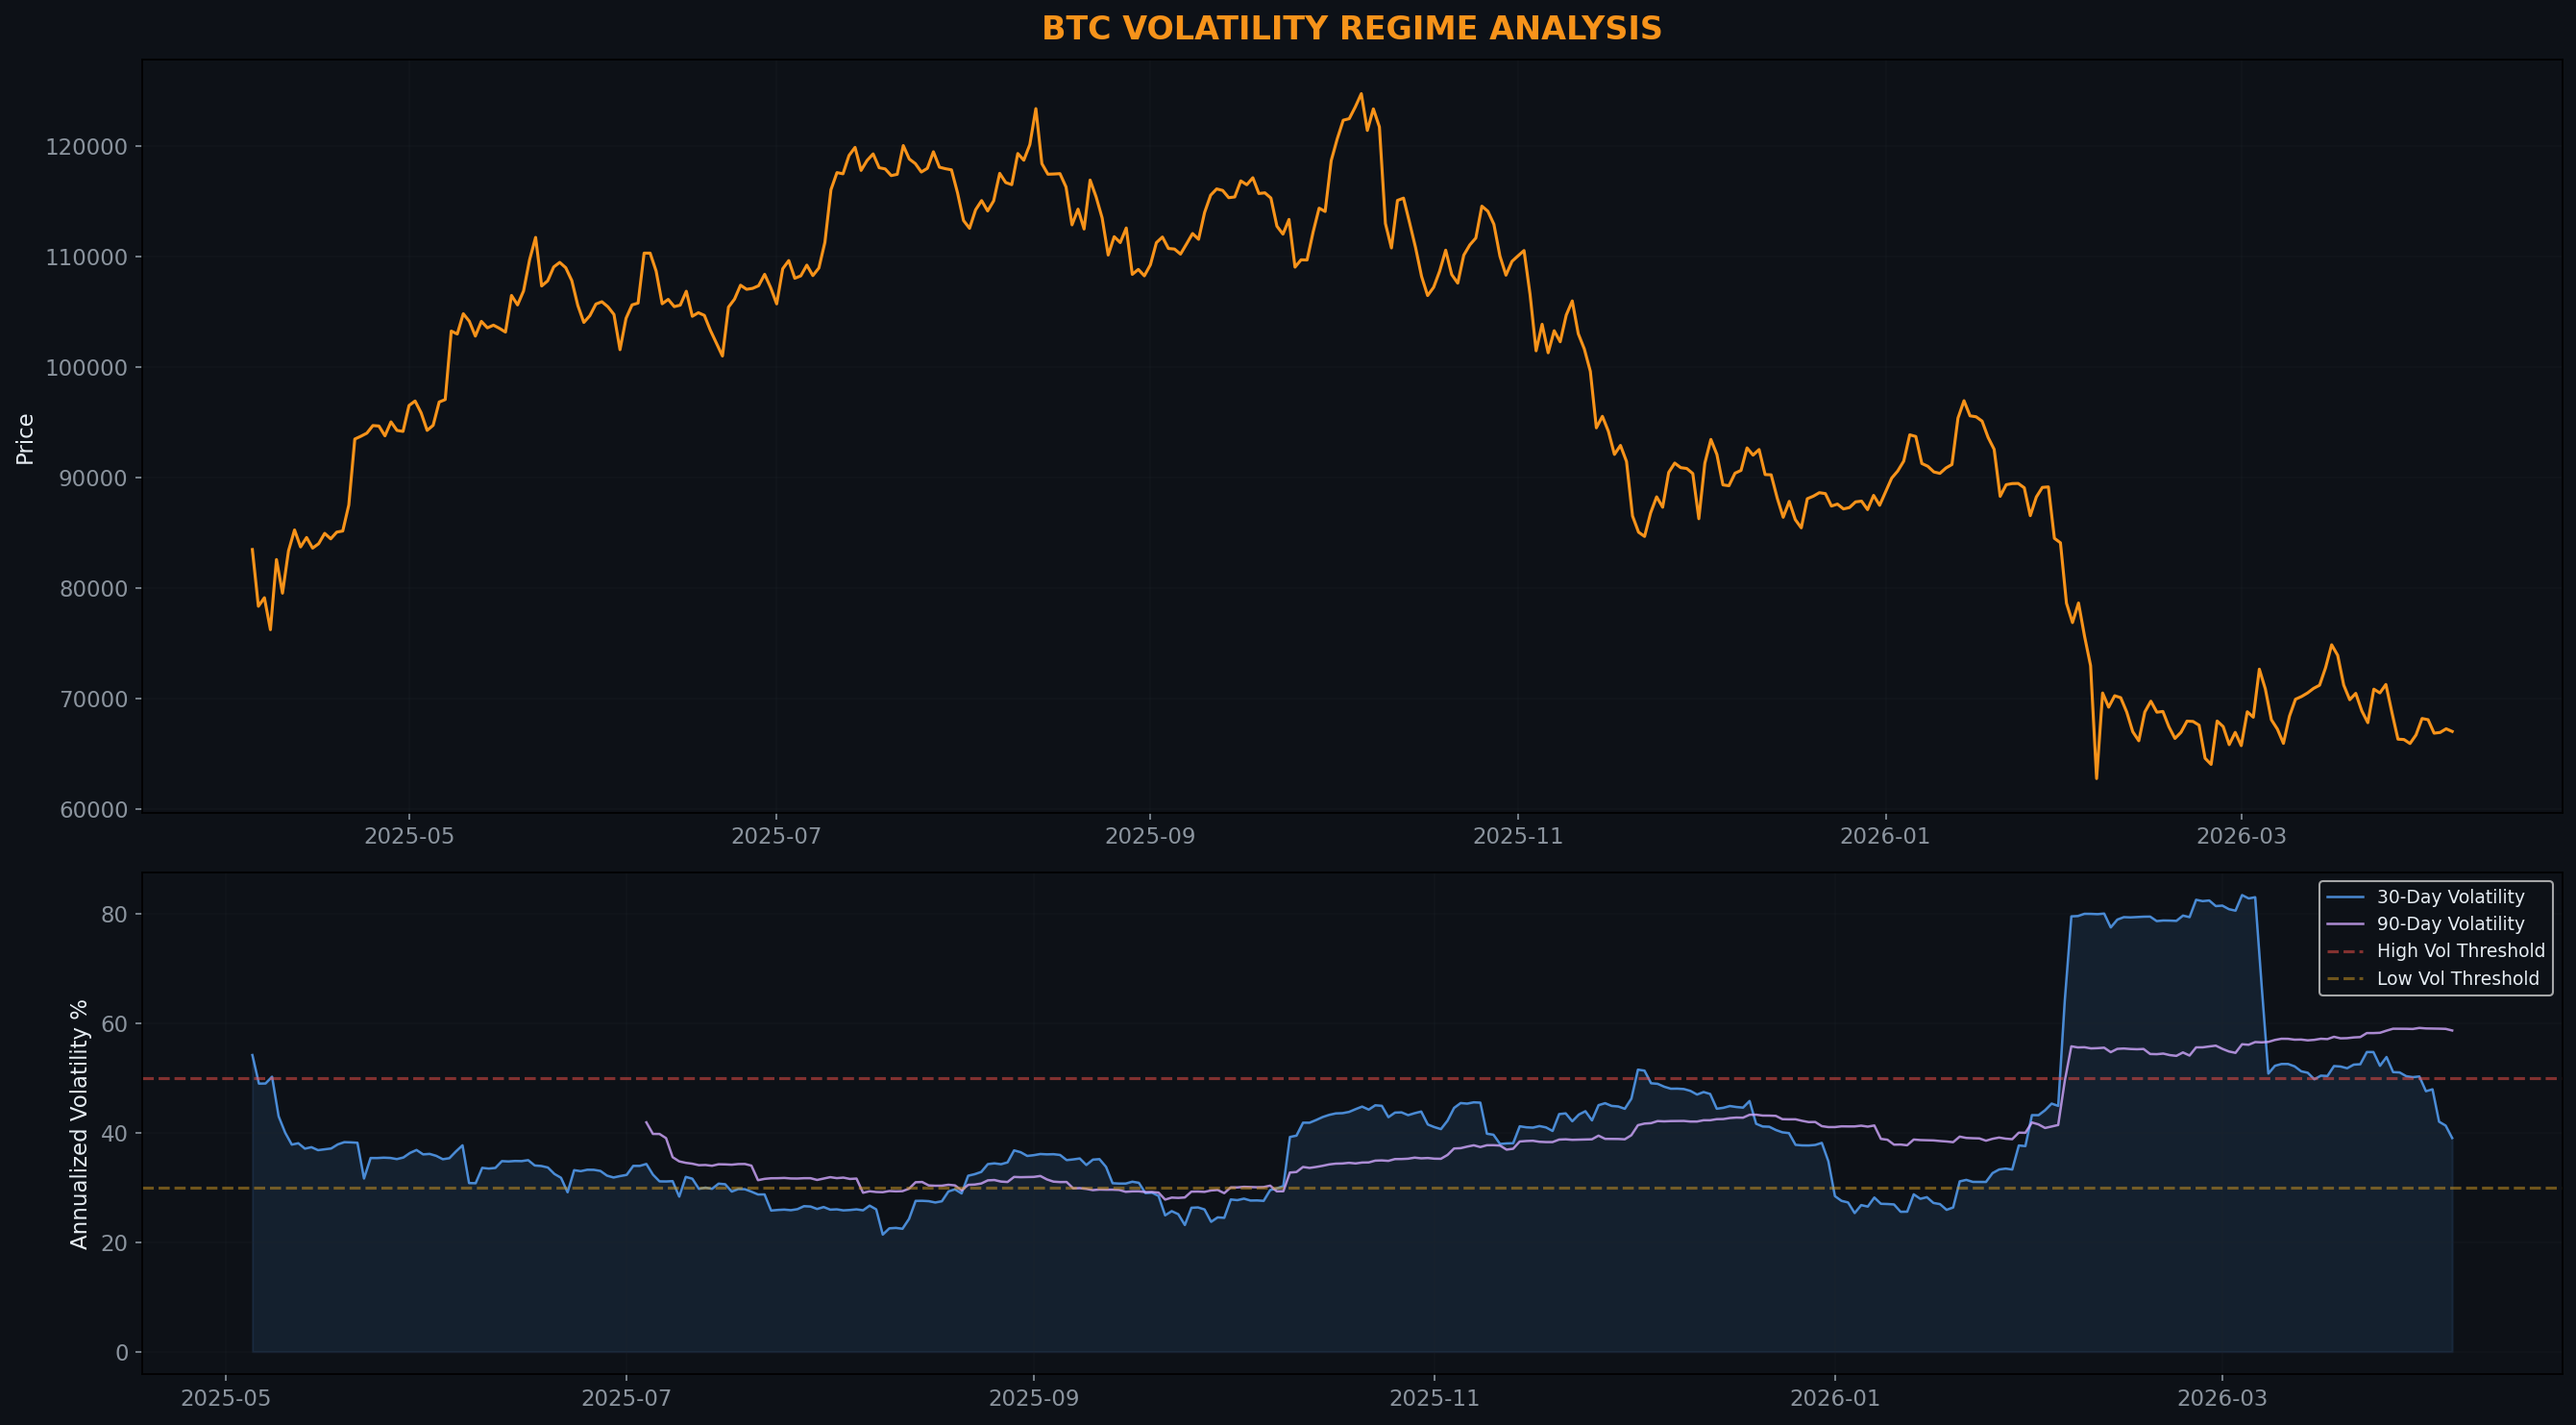
Backtested frameworks, volatility regimes, and composite indicator systems.
Strategy Backtest Results (author-compiled from public backtests — not ledger-measured)
| Strategy | CAGR | Max DD | Win Rate | Notes |
|---|---|---|---|---|
| MACD Histogram | 77.2% | -62% | — | Beats buy-hold |
| RSI Momentum | 122% | -39% | — | Best risk-adjusted |
| BB Mean Reversion | 49.7% | — | 41% | Only 34% time in market |
| Fear-Based DCA | 1,145% (total) | — | — | 2018–2025 backtest |
Composite Indicator Scoring System
7 indicators combined into a single score (0–100). Aggregate reading determines market regime.
Risk Management
Position sizing frameworks, Kelly Criterion, and leverage mechanics.
Position Sizing by Risk Profile
Conservative
Moderate
Aggressive
Leverage Liquidation Table
| Leverage | Liquidation Drop |
|---|---|
| 2x | -50% |
| 3x | -33% |
| 5x | -20% |
| 10x | -10% |
| 25x | -4% |
| 50x | -2% |
| 100x | -1% |
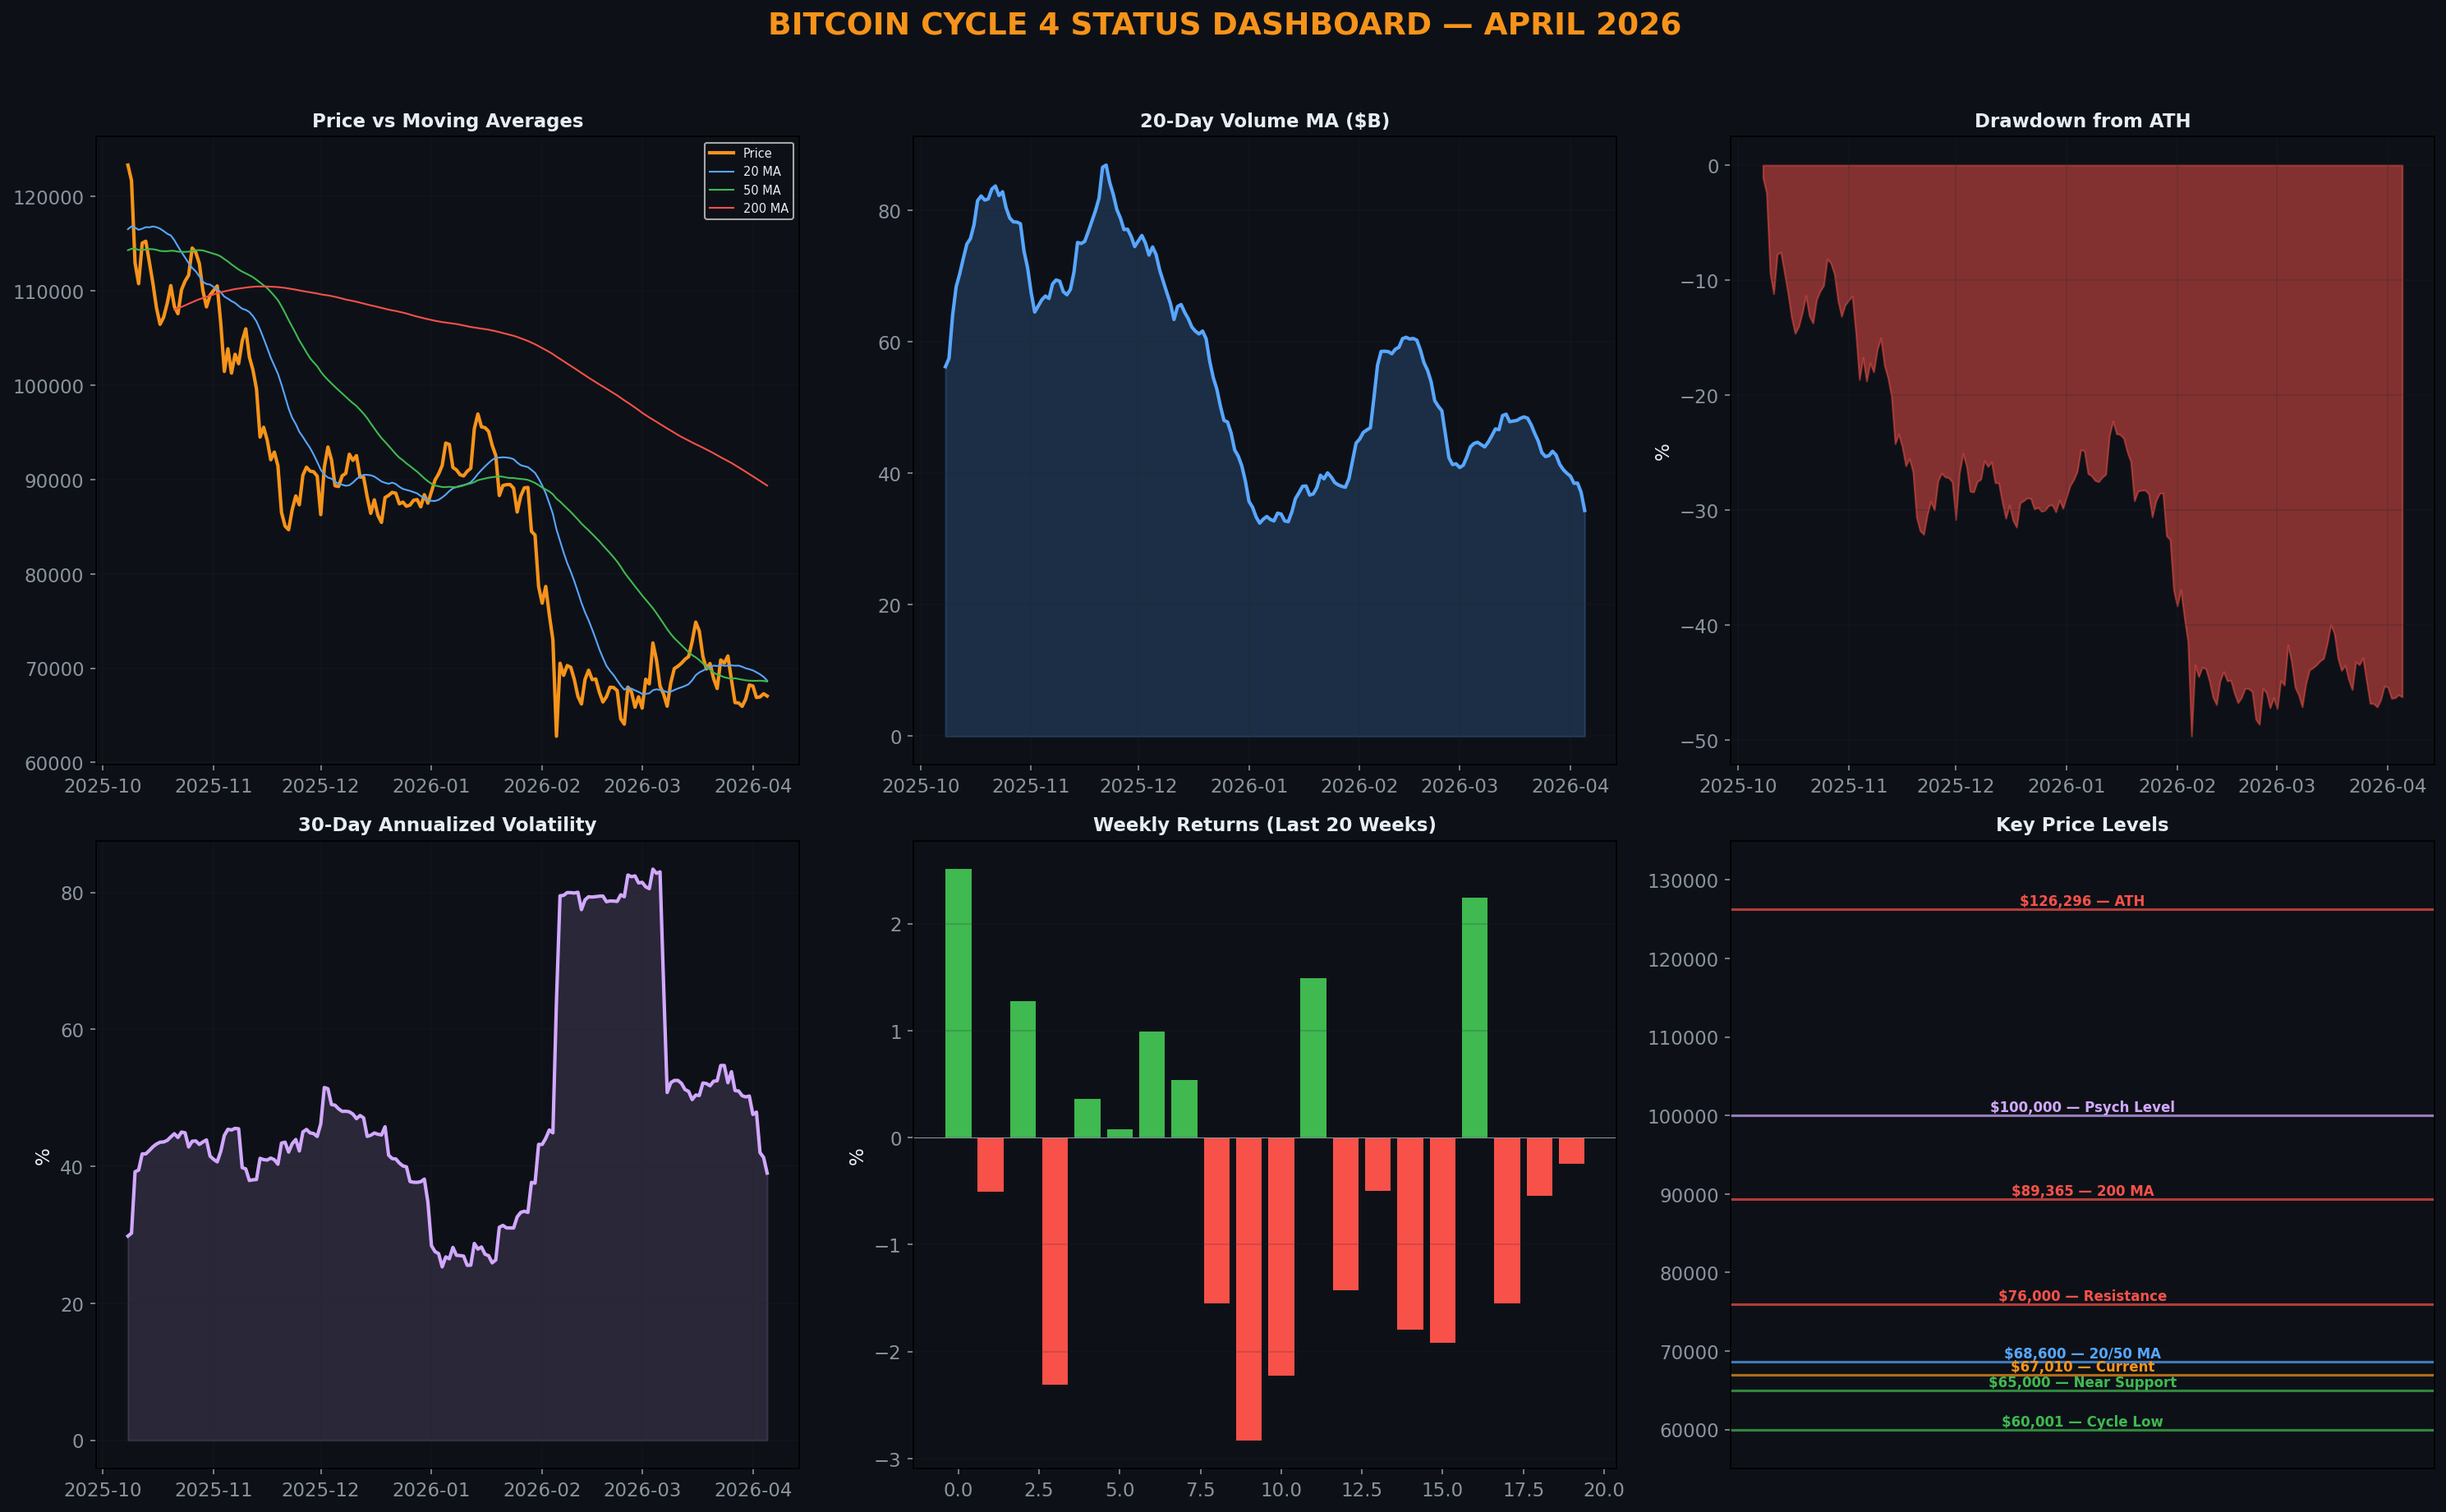
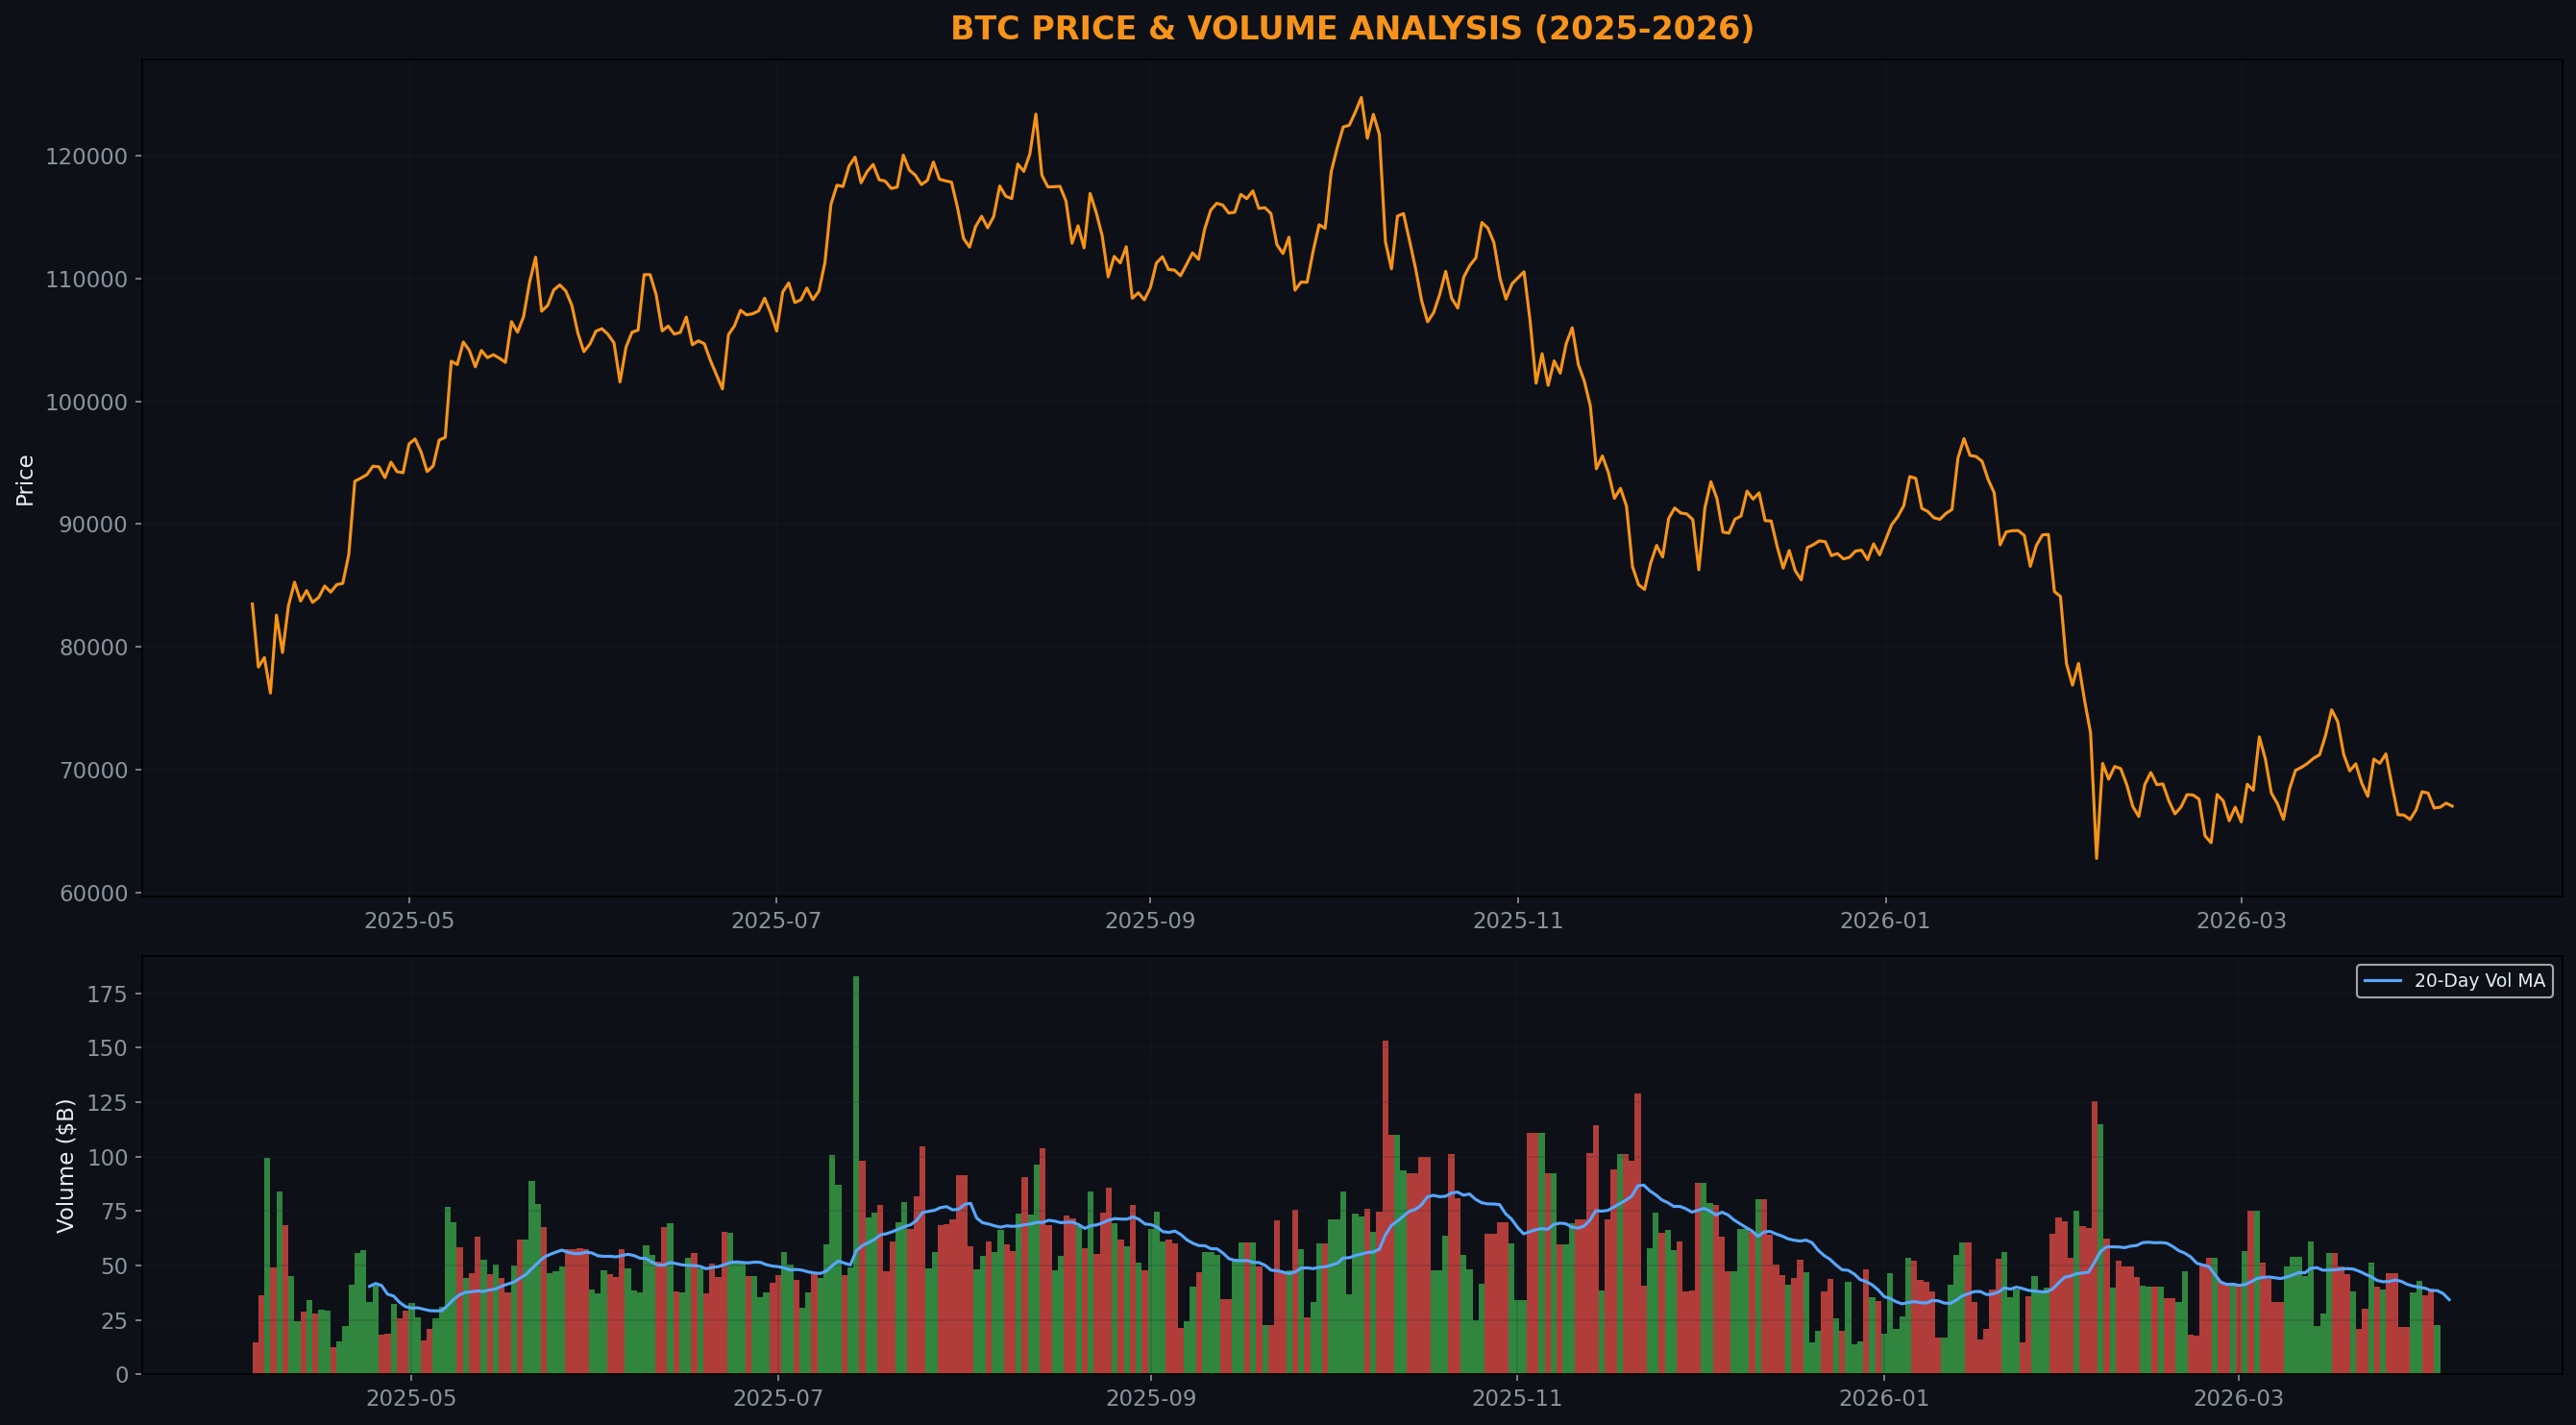
Market Assessment (April 2026, Archived)
A point-in-time market assessment written in April 2026 and preserved as a study artifact. Every price, level, and outlook below is frozen at its writing date — it is deliberately NOT updated, so readers can judge how a dated assessment aged. For current prices and levels see the Live Market Command Center; for measured forecast performance see the Forecast Scoreboard.
Key Price Levels
Price Outlook
Derivatives & Open Interest
Perpetual futures, funding rates, open interest dynamics, options market intelligence, and liquidation cascade mechanics — the derivatives layer that amplifies every BTC cycle.
Perpetual Funding Rate Intelligence
Funding rates settle every 8 hours and represent the cost of holding a leveraged position. Extreme readings are among the most reliable cycle sentiment signals in BTC markets.
| Rate (8h) | Annualized | Signal | Action |
|---|---|---|---|
| +0.1% or higher | 109%+ | Extreme greed — leverage overheated | Reduce longs, watch for cascade |
| +0.01% to +0.05% | 11–55% | Elevated but manageable | Monitor, normal bull regime |
| -0.001% to +0.01% | -1% to 11% | Neutral — healthy market | No signal, trend-follow |
| -0.01% to -0.05% | -11% to -55% | Bearish leverage heavy — shorts piling in | Watch for short squeeze |
| Below -0.05% | -55%+ | Extreme fear — capitulation signal | High-probability accumulation zone |
Open Interest Signal Matrix
| Price | Open Interest | Signal | Interpretation |
|---|---|---|---|
| ↑ Rising | ↑ Rising | BULLISH | New long positions entering — confirmed uptrend |
| ↓ Falling | ↑ Rising | BEARISH | New shorts being added — bearish pressure |
| ↑ Rising | ↓ Falling | SHORTS COVER | Short squeeze — longs may not sustain |
| ↓ Falling | ↓ Falling | LONGS FLUSH | Deleveraging — possible bottom after flush completes |
Major Liquidation Events
| Event | Liquidated | Price Drop | Trigger |
|---|---|---|---|
| COVID Black Thursday (Mar 2020) | $1.2B | -53% in 24h | Global risk-off, crypto-native panic |
| May 2021 China ban | $8.6B | -35% in 72h | Hashrate crash + regulatory fear |
| LUNA collapse (May 2022) | $2.1B | -25% in 7 days | UST depeg, contagion across DeFi |
| FTX collapse (Nov 2022) | $5.2B | -28% in 1 week | Exchange fraud, trust collapse |
| Oct 10, 2025 (largest ever) | $19.35B | -14% in 24h | OI $56.6B → ETF outflows → cascade |
| Feb 5–6, 2026 | $6.18B | -8% in 48h | 7-catalyst convergence, ETF outflows |
Options Market Intelligence
Lightning Network Intelligence
Bitcoin's Layer 2 payment network — capacity growth, adoption metrics, routing economics, and what LN signals tell us about BTC's long-term network value.
Network Capacity Growth (2018–2026)
| Period | Capacity (BTC) | Channels | Context |
|---|---|---|---|
| Mar 2018 | <10 | <1,000 | Mainnet launch, experimental |
| Dec 2019 | 866 | 35,000 | Early growth phase |
| Jan 2021 | 1,060 | 38,000 | Pre-bull surge |
| Oct 2021 | 3,200+ | 80,000+ | El Salvador legal tender law |
| Dec 2022 | 5,100 | 82,000 | Cash App integration, ATH despite bear |
| Dec 2023 | 4,800 | 70,000 | Binance/OKX integration |
| Dec 2025 | 5,637 | ~65,000 | All-time capacity high |
| Q1 2026 (est.) | ~5,200 | ~62,000 | Slight decline with BTC price drop |
LN Metrics as Market Signals
- 📈 Capacity growing faster than price — organic adoption
- 📈 Channel openings accelerating — new participants entering
- 📈 Volume/capacity ratio rising — network being actively used
- 📈 New exchange LN integration — institutional on-ramp expansion
- 📈 AI agent payment adoption — new autonomous demand
- 📉 Capacity declining — channels being closed, funds withdrawn
- 📉 Channel count falling faster than capacity — large nodes leaving
- 📉 Centralization increasing — single points of failure risk
- 📉 Volume plateauing despite capacity growth — adoption stalling
- 📉 Key routing node going offline — liquidity fragmentation
During the 2022 bear market, LN capacity hit an all-time high (5,100 BTC) while BTC price was down 77%. This was a historically bullish signal — the network was growing independent of price speculation. The Federal Reserve found that LN could have reduced 2017's on-chain congestion by 93%. Long-term, LN capacity growth relative to price represents genuine adoption vs speculation, making it one of the few metrics that improves during bear markets.
Advanced Prediction Framework
A disciplined methodology for BTC scenario analysis — tiered inputs, multi-timeframe confidence scoring, historical analog matching, scenario probability weighting, and systematic invalidation logic. Confidence and analog-match figures below are author-set scenario weights, not measured prediction accuracy. They are separate from the public forecast ledger, which scores resolved forecasts against a naive baseline on the scoreboard.
Signal Tier Matrix — What Actually Predicts BTC (author-set ratings and estimates — not ledger-measured)
| Tier | Input | Type | Signal Quality | Notes |
|---|---|---|---|---|
| TIER 1 | Halving Cycle Position | Leading | VERY HIGH | 4/4 cycles followed halving math within 15% |
| TIER 1 | Funding Rate Extreme | Contrarian | HIGH | Extremes (>±0.05%) signal reversals 73% of cases |
| TIER 1 | MVRV Zone | Lagging | HIGH | Cycle bottoms always in MVRV <1.0 zone |
| TIER 1 | Volume Confirmation | Coincident | HIGH | Breakouts with <1.5× avg vol fail 67% of time |
| TIER 2 | Fear & Greed Extreme | Contrarian | MEDIUM | F<20 → 90d median return +42% (2019-2026) |
| TIER 2 | ETF Net Flows | Leading | MEDIUM | 3-5 day lag from flows to price response |
| TIER 2 | OI Direction | Coincident | MEDIUM | OI rising with price = confirmation; against = warning |
| TIER 3 | Social Sentiment | Lagging | LOW | Noisy. Only useful at extreme readings |
| TIER 3 | News Catalysts | Coincident | LOW | Reaction often fades. Trend remains dominant |
April 2026 Scenario Probability Map
Ten questions
No score is saved, nothing is tracked — this is just for you. Each answer explains itself, and every explanation links back to the chapter that covers it.
Quick Reference & Glossary
Key Thresholds — Quick Reference
Glossary
- Bitcoin
- Digital money secured by a global network of computers instead of a bank; capped at 21 million coins ever.
- Blockchain
- The shared public record of every Bitcoin transaction, kept identical on thousands of computers that constantly cross-check each other.
- Mining
- The work of securing the network by racing to add the next block of transactions; the winner earns newly created bitcoin plus fees.
- Wallet
- Software or a device that holds the secret keys which control your bitcoin. The coins live on the blockchain; the wallet holds the keys.
- Private Key
- The secret number that lets you spend your bitcoin. Anyone who has it, has your coins — which is why it is never shared.
- Satoshi
- The smallest unit of bitcoin — one hundred-millionth of a coin. Also the pseudonym of Bitcoin's unknown inventor, Satoshi Nakamoto.
- Exchange
- A business where people trade regular money for bitcoin. Convenient, but coins left there are an IOU until withdrawn to your own wallet.
- Leverage
- Trading with borrowed money. It multiplies gains AND losses — a small move against a highly leveraged position erases it entirely.
- MVRV
- Market Value to Realized Value — compares market cap to the cost basis of all coins.
- NUPL
- Net Unrealized Profit/Loss — proportion of the network in profit vs loss.
- Puell Multiple
- Daily miner revenue relative to the 365-day average — measures miner profitability.
- Reserve Risk
- Ratio of price to hodler conviction — low values = high conviction, cheap price.
- Halving
- Block reward cut in half every 210,000 blocks (~4 years). Reduces new BTC supply.
- Death Cross
- 50-day MA crossing below the 200-day MA. Often a lagging indicator in BTC.
- Golden Cross
- 50-day MA crossing above the 200-day MA. Historically bullish signal.
- DCA
- Dollar Cost Averaging — systematic periodic buying regardless of price.
- Kelly Criterion
- Optimal bet sizing formula based on win rate and payoff ratio.
- Fear & Greed Index
- Composite sentiment metric (0=extreme fear, 100=extreme greed).
- MACD
- Moving Average Convergence Divergence — momentum and trend indicator.
- RSI
- Relative Strength Index — oscillator measuring overbought/oversold conditions.
- Bollinger Bands
- Price envelopes 2 standard deviations from the 20-day SMA.
- DXY
- U.S. Dollar Index — measures dollar strength against a basket of currencies.
- Drawdown
- Peak-to-trough decline from an all-time high. Measures downside risk.
- HODL
- Hold On for Dear Life — long-term holding strategy regardless of volatility.
- On-Chain
- Data derived directly from the blockchain (transactions, addresses, flows).
- Spot ETF
- Exchange-traded fund holding actual Bitcoin, providing regulated institutional access.
- Black Swan
- Unpredictable, high-impact event that retrospectively appears inevitable.
- Volatility Regime
- Market phase defined by realized volatility levels (low, medium, high, extreme).